Entries from December 8, 2013 - December 14, 2013
UK construction revision boosts 2013 growth
Upward revisions to construction output released today are likely to prompt a further round of upgrades to 2013 GDP growth estimates, consistent with the long-standing view here that the economy will eventually be shown to have expanded by about 2% this year.
Construction output is now estimated to have risen by 4.8% between the fourth quarter of 2012 and the third quarter of 2013, a substantial change from 2.2% a month ago. With construction accounting for 6.3% of GDP, this implies that the latter grew by 2.00% rather than 1.84% between the two quarters, assuming no revisions to output in other sectors. Revised GDP figures are released next week.
Construction, moreover, is on course to make another solid contribution to fourth-quarter GDP expansion. The October level of output was 2.0% above the third-quarter average and, if sustained, implies that the sector will add 0.13 percentage points to the change in GDP this quarter.
The Office for Budget Responsibility last week projected a 1.4% rise in GDP in 2013 based on assumed 0.7% growth in the fourth quarter. Today’s construction revision suggests a full-year number of 1.5%, maintaining the fourth quarter assumption. The latter, however, seems low relative to other evidence – 0.9% growth would generate a full-year GDP increase of 1.6%.
The revisions process remains at an early stage and the expectation here is that the numbers for the dominant services sector will be raised over coming months, bringing 2013 GDP growth up towards 2.0%.
Chinese monetary trends still soft
Monetary trends and survey evidence continue to suggest that the Chinese economy will slow into early 2014.
Activity strengthened over the summer, with six-month growth in industrial output* reaching a 15-month high in September. This followed respectable real money expansion in early 2013 – see first chart. Improving prospects were confirmed by a rise in the official purchasing managers’ new orders index** from the spring.
Real broad and narrow money growth, however, slowed sharply after April, the latter falling well beneath its historical average. October figures today were soft again. This warning signal has received tentative support from a fall in the new orders index since August, although the current reading remains respectable. Six-month output expansion ticked down in October, possibly marking the start of a downshift.
The tightening of monetary conditions is a side-effect of official efforts to clamp down on excessive non-bank credit creation. The one-month repo rate, a gauge of money market liquidity, was below the levels of the last two years in early 2013 but is now significantly higher – second chart. Ongoing policy restriction suggests that monetary trends will remain subdued.
*Level series estimated from official data and seasonally adjusted.
**Seasonal adjustment applied to published data.


Broad monetarism still dominant but narrow money signals more reliable
Most monetary economists, and British monetarists in particular, focus on trends in broad money and credit when forming an assessment of monetary conditions. The approach here considers narrow money developments, additionally, to contain important information, particularly for forecasting purposes.
The dominance of broad monetarism partly reflects the influence of Friedman and Schwarz, who emphasised a broad measure in their seminal A Monetary History of the United States, 1867-1960. In the UK, leading monetarists, including Professors David Laidler and Tim Congdon, have framed theories of monetary equilibrium in terms of broad money.
A further reason for the neglect of narrow money is a widespread tendency to confuse the concept with the monetary base, i.e. currency in circulation and bank reserves held at the central bank. QE policies, clearly, have disrupted any relationship that existed between the monetary base and the economy.
Narrow money, by contrast, refers to forms of money that can be used by non-banks to make final payment when purchasing goods, services or assets. A narrow money aggregate should, at a minimum, include currency held outside the banking system and checkable deposits; not all instant-access deposits, however, can be used in immediate, final settlement. In practice, data availability constrains the construction of an “ideal” aggregate; the nationally-defined M1 measure is used for most countries followed here. Narrow money, to repeat, does not include bank reserves so is not automatically boosted by QE.
Broad monetarists continue to dominate the airwaves, enjoying support from prominent media commentators, but their forecasting performance has been distinctly patchy in recent years. Narrow money signals, by contrast, have been generally reliable.
-
Global real narrow money contracted ahead of the 2008-09 recession; broad money growth slowed but remained solid by historical standards – see chart.
-
The broad monetarists forecast “double dips” in 2010 and 2011 as real broad money growth fell below the low reached in the 2008-09 recession; narrow money, by contrast, signalled that economic expansion would slow but remain respectable.
-
Real narrow money growth fell sharply around end-2011, warning of economic weakness in mid-2012; broad money expansion was solid and stable over this period.
The narrow monetarists have scored additional major wins at the country level. In particular, narrow money gave a much stronger signal that the Eurozone crisis would abate from late 2012, and that UK economic growth would far exceed official and consensus expectations in 2013.
Global real narrow and broad money are currently giving a consistent message: growth has moderated since spring 2013, suggesting that economic expansion is close to a peak but will remain respectable in early 2014.
There are, however, divergences at the country level. Broad monetarists, for example, are warning of a “triple dip” in the Eurozone because real M3 has recently stagnated, but M1 continues to expand solidly, suggesting that a slowburn economic recovery will proceed. There is an opposite signal in China, with narrow money giving a more downbeat message for economic prospects.
The dominant influence of the broad monetarists combined with their evident inability to produce reliable forecasts may explain why economists generally continue to devote little attention to monetary analysis. This may allow narrow monetarists to retain a forecasting advantage but policy-makers are likely to make further mistakes while they neglect important monetary signals.
Global leading indicators confirm coming growth peak
The approach to forecasting the global cycle employed here relies partly on short and longer-term leading indicators calculated by transforming and combining the OECD’s country leading indices. The message from these derived indicators often disagrees with the OECD’s interpretation of its own data.
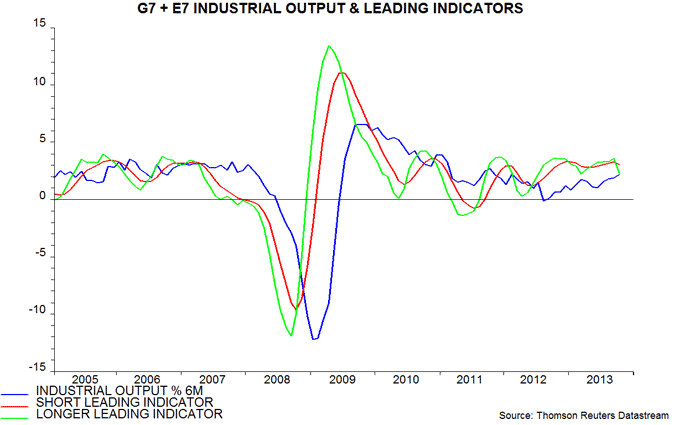
For example, today’s OECD press release accompanying the release of October figures states that its indicators “point to an improving economic outlook in most major economies”. The derived short and longer-term indicators, however, fell from September highs, suggesting that current strong global growth is approaching a peak – see first chart.
The short and longer-term indicators have led turning points in six-month industrial output momentum by averages of three and five months respectively in recent cycles. The September peak in the two indicators, therefore, is consistent with global industrial output expansion topping out between December and February.
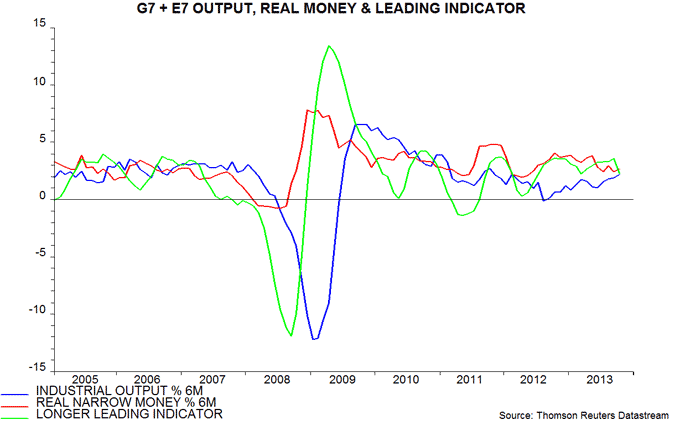
The signal from the indicators is consistent with monetary trends: global six-month real narrow money expansion peaked in May and typically leads output growth by six months or so – second chart. The latest monetary data, for October, remain respectable, suggesting that economic momentum will moderate rather than slow sharply in early 2014.


