Entries from November 17, 2013 - November 23, 2013
Could the next BoE interest rate move be a cut not rise?
A cut in Bank of England official rates is not the central expectation here, and is certainly not recommended, but is worth considering for the following reasons:
-
Other central banks have made or are considering changes to remuneration arrangements for bank reserves and the Bank of England is a devoted follower of fashion. The ECB this month lowered its main refinancing rate, which is also the rate paid on required reserves, from 0.5% to 0.25%, while President Draghi stated that a cut in the rate on excess reserves (i.e. the deposit facility rate) from zero to negative was discussed. The latest FOMC minutes, meanwhile, revealed that “most participants thought that a reduction by the Board of Governors in the interest rate paid on excess reserves could be worth considering” in order to anchor short-term interest rates and reinforce the Committee’s forward guidance.
-
The ECB cut means that the rate paid on UK reserves is the highest of the major central banks. The Bank of England pays Bank rate of 0.5% on reserves versus 0.25% / 0.25% on required and excess reserves in the US, 0.25% / 0% in the Eurozone and 0% / 0.1% in Japan. The MPC may be concerned that a widening differential is contributing to upward pressure on sterling.
-
The MPC believes that the rising rate path discounted in markets is too hawkish and is acting as an unnecessary growth drag. This was signalled in the November Inflation Report by a mean forecast that inflation would be slightly below target in two years’ time if Bank rate followed the market-implied path. Market rates have failed to adjust lower despite Governor Carney reaffirming dovish forward guidance. An official rate cut could “shock” markets into accepting the MPC’s desired rate path and could be defended as a response to recent lower-than-expected inflation.
-
The MPC has previously ruled out a cut in Bank rate on the grounds that it could constrict credit supply by reducing the profitability of some lenders, especially building societies. The funding for lending scheme, however, has allowed lenders to widen margins, possibly lessening this concern.
The Bank could choose simply to cut Bank rate by 25 basis points to 0.25% but would be more likely to emulate the ECB by reintroducing reserve requirements, paying a lower rate on excess balances held in the standing deposit facility – maintaining Bank rate, and the rate on required reserves, at 0.5% would mitigate point 4 above. Setting the deposit rate at 0.25% would result in the overnight rate dropping to about this level from 47 basis points currently, with a knock-on effect along the money market yield curve.
UK vacancy rate suggests limited labour market slack
The November Inflation Report reaffirmed the MPC’s view that there is significant “effective” slack in the UK labour market. This view rests partly on an estimate that the “medium-term equilibrium unemployment rate” – a measure relevant for assessing wage pressures over the MPC’s three-year forecast horizon – is currently 6.5% versus an actual rate of 7.6% in the third quarter of 2013. This suggests that the MPC will allow unemployment to fall beneath the 7.0% forward guidance threshold before raising interest rates, and may even lower the threshold as the actual rate approaches this level.
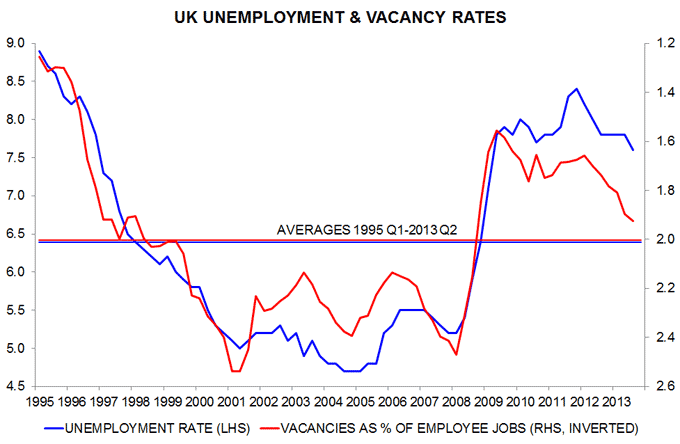
An alternative employer-based measure of labour market slack is the vacancy rate – the stock of unfilled positions expressed as a percentage of the number of filled employee jobs. If effective labour supply were much higher than demand, as the MPC believes, employers would find it easy to fill job openings and the vacancy rate would be low and stable. It has, in fact, risen significantly over the last 18 months – from 1.65% in the first quarter of 2012 to 1.9% in the third quarter of 2013. The latter matches the fourth quarter of 2008, suggesting that labour market slack is similar now to then. This is at odds with the message from the unemployment rate, which is 1.2 percentage points above its level of 6.4% in the fourth quarter of 2008.
The first chart compares the unemployment and vacancy rates since 1995, with the latter plotted inverted*. The scales have been adjusted to align the 1995-2013 averages of the two series. The current vacancy rate of 1.9% is only 0.1 percentage points below its 2.0% average, suggesting that – from the perspective of employers – labour market conditions are close to normal. The unemployment rate of 7.6%, however, remains far above its 6.4% average – close to the MPC’s current estimate of the “medium-term equilibrium rate”.
The message from the vacancy rate accords with business survey evidence. In the third quarter British Chambers of Commerce survey, the seasonally-adjusted percentage of manufacturers reporting recruitment difficulties was above its post-1995 average, while the services percentage was below average by the smallest margin since the fourth quarter of 2008.
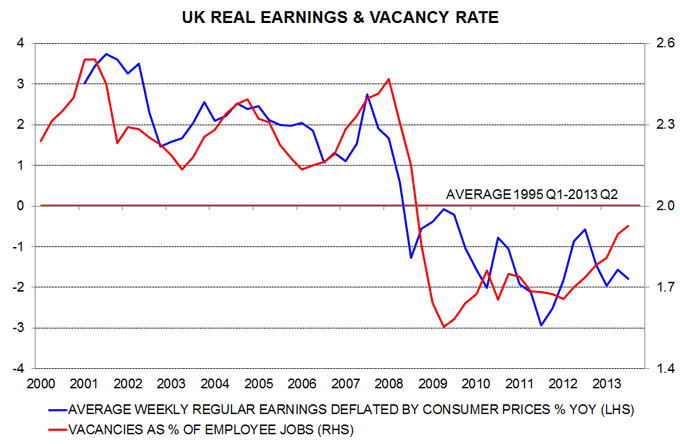
The second chart shows the vacancy rate – no longer inverted – and annual growth of inflation-adjusted regular earnings (i.e. excluding bonuses). Real earnings started to contract as the vacancy rate moved below average in late 2008. On current trends, the rate will rise above 2.0% during the first half of 2014, suggesting that nominal earnings growth will recover and move above inflation later next year.
A resumption of real earnings expansion would, of course, provide welcome relief for hard-pressed consumers but would need to be matched by improved productivity performance to prevent upward pressure on unit labour costs / prices, or else a further squeeze on profits. The view here is that, in addition to being too sanguine about labour market slack, the MPC is overoptimistic about productivity prospects – available evidence suggests continued weakness in the third quarter despite strong economic growth, as noted in a post last week.
*The vacancy rate was estimated before the second quarter of 2001 by linking the current employer survey based vacancies series with an earlier series, ending in the first quarter of 2001, covering vacancies at job centres. This linking assumes that 1) the vacancy rate was unchanged between the first and second quarters of 2001 (reasonable – unemployment was little changed between the two quarters) and 2) job centre vacancies were a constant proportion of total vacancies from 1995 to 2001.


US stock market rise stretched relative to history
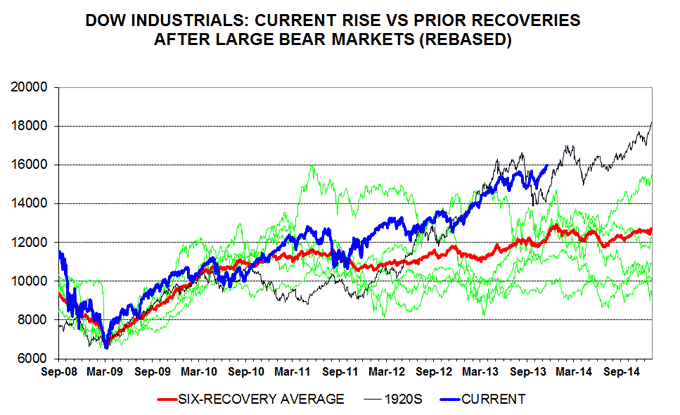
Previous posts have compared the rise in the Dow Jones Industrials index from its March 2009 low with increases after six previous bear markets involving a peak-to-trough fall of about 50%. (The Dow declined by 54% between October 2007 and March 2009.) As explained below, the Dow is currently outpacing these prior rises.
The six bear market troughs considered in this analysis occurred in November 1903, November 1907, December 1914, August 1921, April 1942 and December 1974. The Dow Industrials fell by between 45% and 52% into these lows. (The 1929-32 bear market was excluded because it involved a much larger decline, of 89%.) In each of the six cases, the trough of the bear market was rebased and shifted forwards in time to match the March 2009 low. The subsequent rises were then traced out and an average calculated – see chart.
This “six-recovery average” proved to be a good guide to the underlying trend in US stocks over the two-and-a-half years following the 2009 trough. Since late 2011, however, the Dow has diverged positively from the average and is currently above the top of the range spanned by the historical rises.
The closest resemblance is to the “roaring twenties” increase from the August 1921 trough – the black line in the chart. The equivalent month to November 2013 was May 1926. If the Dow were to replicate its performance then, it would rise to 17,000 in February 2014 before falling back to 15,000 in April. It would make no net progress between now and July 2014.
The fall from the equivalent of 17,000 to 15,000 occurred in September-October 1926 as the US economy was entering a 13-month recession. This recession followed a rise in short-term interest rates – the three-month Treasury bill rate increased from less than 2% in 1924 to more than 3.5% – and a stagnation of the narrow money supply.
Bulls argue that there is no recession in sight while unprecedented central bank monetary manipulation will continue to force investors into equities, making historical comparisons redundant. The assessment here is more cautious: longer-term bond yields have risen significantly, the global real money supply is no longer outpacing output and growth may be reaching a peak – see yesterday’s post. The historical suggestion that the Dow is overstretched and will, at best, tread water through mid-2014 may prove more than a curiosity.
Global growth: peak or plateau?
The forecasting measures employed here continue to suggest that global growth is reaching a peak in late 2013 but will remain respectable in early 2014.
The primary forecasting indicator is global* real narrow money supply expansion, which has led turning points in economic growth by an average of six months since 2008. The six-month rise in real money peaked in May 2013, consistent with the current pick-up in global industrial output growth topping out in November – see first chart**. Real money expansion remains respectable by historical standards and comfortably above a low reached in April 2012 before a temporary but significant economic slowdown.
Confirmation for monetary signals is sought from a global longer leading indicator derived from the OECD’s country leading indices. This indicator has led growth turning points by an average of five months since 2008 and reached a 2013 maximum in July, suggesting an economic cycle peak in December – second chart. The fall since July has been minor – further evidence that any economic slowdown in early 2014 will be modest.
A November / December industrial growth peak ought to be signalled by some reversal of recent strength in global manufacturing purchasing managers’ surveys. Equity analysts’ earnings revisions have softened so far in November and correlate loosely with the G7 PMI new orders index – third chart.
G7 labour markets may continue to improve in early 2014 despite a topping-out of growth. This is because 1) employment / unemployment are lagging indicators, 2) growth, while slowing, may match business expectations and 3) productivity performance may remain weak.
Growth peaks – even minor ones – are often associated with set-backs for equities and other risk assets. Market hopes that the Federal Reserve would rush to the rescue by further delaying “tapering” could be disappointed if the US unemployment rate continues to trend lower.
*G7 plus emerging E7.
**The last data points are October estimates.


