Entries from October 27, 2013 - November 2, 2013
UK consumer recovery is soundly-based and welcome
Having failed to predict the current economic upswing, the commentariat now decries the “wrong kind of growth”. A typical “argument”: consumer credit rose at an annualised rate of 6.0% in the latest three months, while average weekly earnings are up by only 0.7% over the past year; so consumers must now be “releveraging” to finance another spending splurge, even though debt is still at an unsustainable level.
Wrong, wrong, wrong. Consumer credit accounts for only 9% of the stock of household sector borrowing from banks, which is dominated by mortgages. Total borrowing rose by 1.5% annualised over the last three months and is only 1.0% higher than a year ago.
This borrowing rise needs to be compared with total income growth, not the increase in average weekly earnings. Solid expansion in employee numbers coupled with stronger self-employment and entrepreneurial income resulted in non-property-related earnings rising by 4.1% in the year to the second quarter. Borrowing, therefore, continues to grow more slowly than income.
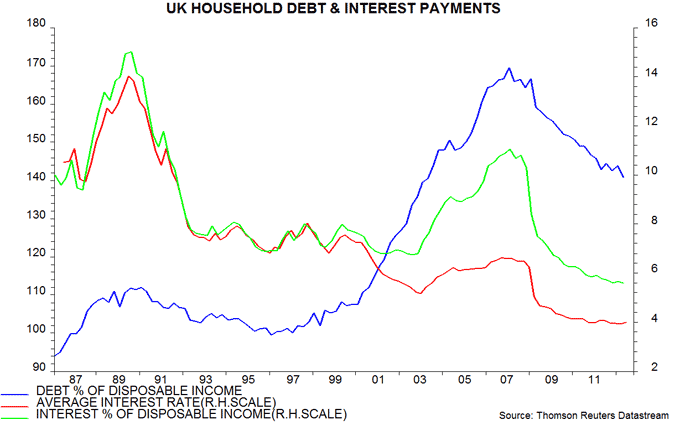
Total household debt was 141% of disposable income at the end of the second quarter versus a 2008 peak of 170% – see chart. A judgement about sustainability should take into account the burden of interest service and the value of assets. Interest payments were 5.6% of income in the second quarter, a low in data extending back to 1987. The interest burden would remain below its post-1987 average of 8.6% even if the average interest rate on debt rose by 2 percentage points. The ratio of debt to wealth, meanwhile, is likely to fall below its post-1987 average of 17.4% in 2013, reflecting house and share price gains and saving.
So borrowing isn’t surging, incomes are growing respectably and debt is consistent with servicing capacity and wealth.
A consumer splurge? The volume of spending in the second quarter was no higher than in the second quarter of 2007. Is six years of stagnation insufficient for the killjoys?

UK house prices still inexpensive relative to rents
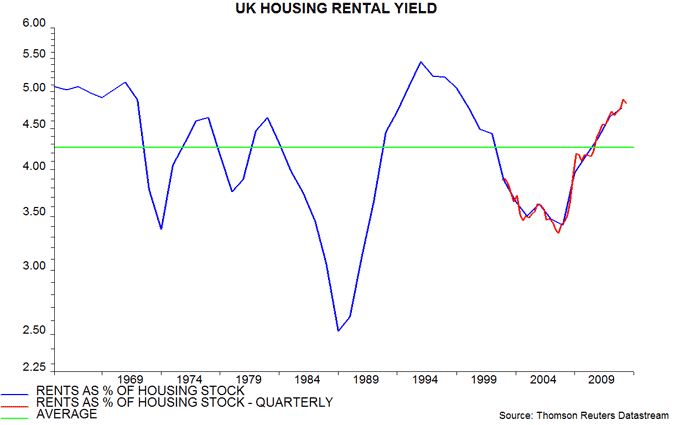
A measure of the rental yield on residential property derived from the national accounts edged down in the second quarter but remains comfortably above its long-run average, suggesting that house prices are undervalued relative to rents.
The national accounts yield measure is calculated by dividing the sum of actual rental payments and imputed rents of owner-occupiers by the value of the housing stock. The yield is calculated on a trailing 12-month basis, i.e. its second-quarter value equals rents in the year to June divided by the end-June value of the housing stock.
The rental yield has averaged 4.26% since 1965, moving well below this level during the house price bubbles of the early 1970s, late 1980s and 2000s associated with monetary laxity overseen respectively by Chancellors Barber and Lawson and Bank of England Governor King (all subsequently awarded peerages).
The yield reached a low of 3.34% in the third quarter of 2007, suggesting that house prices were then overvalued by 28% relative to rents (i.e. the percentage deviation of 4.26 from 3.34). It has since risen steadily, reflecting a fall in prices in 2008-09 and sustained solid growth in rents.
The yield was an estimated* 4.84% at the end of the second quarter, consistent with house price undervaluation of 12%.
Houses remain expensive in terms of earnings but bubbles are characterised additionally by an overshoot of prices relative to rents, as rose-tinted perceptions of capital gains potential distort assessments of the merits of owning rather than renting. Government policies designed to stimulate home-buying are ill-advised but current prices are far from bubble territory.
*The value of the housing stock at end-June was estimated by linking a published end-December reading to the change in the ONS house price index between December and June.
UK narrow money growth still surging; BoE asleep at wheel (again)
UK monetary statistics for September suggest that strong economic expansion will continue at least through spring 2014.
The forecasting approach here focuses on six-month growth of real narrow money, as measured by non-financial M1, comprising cash and sight deposits held by households and non-financial firms. This rose further to 5.3% in September, or 11.0% annualised – see first chart. Current growth is the highest since August 2004, ahead of an economic boom*.
Real non-financial M1 has been an excellent predictor of the economy in recent years, signalling the 2008-09 recession, 2010 rebound and 2011-12 “soft patch”, as well as this year's acceleration – first chart. The ECB this month published research showing that Eurozone real non-financial M1 has a “robust” leading relationship with GDP fluctuations. The Bank of England, by contrast, ignores the UK aggregate – it is a safe bet that no MPC member is aware of the recent surge.
Real non-financial M4, a broader measure also including time deposits and cash ISAs, grew by a moderate 1.2%, or 2.4% annualised, in the six months to September – first chart. M4 has displayed a looser relationship with the economy and is probably understating the degree of monetary stimulus at present, since the further large drop in deposit interest rates over the past year is likely to have depressed the demand to hold broad money. Put differently, the fall in rates has boosted the velocity of circulation of broad money – this is indirectly captured by the surge in M1.
Real narrow money growth is notably stronger than in the rest of the G7, suggesting that recent economic outperformance will continue – second chart.
The “monetarist” rule is that money supply changes affect economic activity in the short run but filter through to prices after about two years. The downside of recent monetary trends is that the current decline in inflation is likely to reverse from early 2014 in lagged response to faster money growth since 2011. The MPC may face a “crunch point” next spring as unemployment nears 7%, the housing market overheats and inflationary clouds darken.
*Gross value added excluding oil and gas rose by 5.3% in the year to the fourth quarter of 2005.


