Entries from September 2, 2012 - September 8, 2012
"Excess" money investment rule: an update
The third “monetarist” forecasting rule followed here is that financial markets usually perform better when the real money supply is growing faster than economic output – this suggests that there is “excess” liquidity available to push up asset prices.
Excess liquidity can buoy all markets or flow into a particular asset class, depending on the stage of the business cycle and other factors. A typical sequencing would be for “safe” bonds to perform strongly around the trough of the cycle followed by equities and lower-grade credit in the recovery phase, with commodities and property taking up the baton as the upswing matures and the economy reaches capacity limits.
A simple stock market investment rule that acknowledges this sequencing is to buy global equities six months after the annual change in G7 real narrow* money growth crosses above that of industrial output and move into cash immediately on a reversal. The six-month entry lag allows for excess liquidity to flow initially into bonds – equities, indeed, often struggle during this window, perhaps reflecting negative earnings news related to economic weakness.
As discussed in previous posts, such a rule would have significantly outperformed a passive investment strategy. Between the start of 1970 and the end of 2011, global equities returned 2.4% per annum more in US dollar terms than US cash. The monetarist investment rule would have delivered 6.1%. The first chart below updates a cumulative excess return comparison.
The investment rule moved to cash in January 2010 but switched back into equities in September 2011, since when global stocks have outperformed by 18% (as of the end of August). The “buy” signal remains in force, with G7 real narrow money up by an annual 9% in July versus an estimated 3% increase in industrial output – second chart.
The current version of the rule, however, fails to take account of the now-significant influence of emerging economies on global growth and liquidity conditions. Emerging E7 real narrow expansion is currently below that of industrial output, implying deficient liquidity and helping to explain recent lacklustre performance of emerging equity markets.
A possible resolution is to reformulate the rule in terms of G7 plus E7 real money and industrial output. Recent signals, in fact, have been identical to the original rule, since G7 liquidity developments have dominated the global aggregate – third chart.
The current positive reading, of course, does not preclude a near-term drawdown but the historical record suggests that, from the September 2011 entry point, equities will have outperformed cash by the time of the next liquidity “sell” signal.
*A narrow money measure is preferred because excess liquidity is likely to be transferred into demand / sight deposits prior to an increase in investment or spending. The historical performance of a rule based on broad money is inferior.


US QE3 choreography requires weak August payrolls
US payroll employment is an overrated economic statistic – the jobs tally is, at best, a coincident indicator of the economy while the “noise” element of early estimates is high. The August figure to be released on Friday, however, deserves attention because of its likely influence on whether the Fed launches QE3 next week. While forecasting is hazardous, there are several reasons for thinking that risks lie to the downside of the 125,000 rise expected by the consensus, according to Thomson Reuters:
-
The headline payrolls measure based on a survey of firms has diverged recently from an alternative measure derived from a poll of households. The July household survey reading was little changed from May and down 558,000 from a peak reached in February – the headline measure, by contrast, rose by 525,000 between February and July. The household measure seems to lead at turning points – see first chart.
-
Payrolls should correlate with withheld employment taxes, after allowing for wage inflation. Adjusted for seasonals and the number of working days, tax withholdings fell in August while a three-month moving average is lower than in the spring – second chart. (Caveat: tax receipts are even noisier than payrolls.)
-
The Monster employment index of online job postings led payrolls at the 2008 peak and 2010 trough and has stalled since February (the same month the household survey payrolls measure peaked) – third chart.
A weak August employment report could be just what Dr Bernanke ordered to quell the opposition of regional Fed “hawks” to his latest bond-buying plans.


“Monetarist” prediction of late 2012 / 2013 inflation revival on track
G7 consumer price inflation has fallen from a peak of 3.1% in September 2011 to 1.4% by July 2012 but is likely to rebound into 2013 as recent increases in energy and food commodity costs filter through the pricing chain. Even assuming no further rise in commodity prices, the G7 headline rate may return to about 2% by early next year.
Commodity price strength is the proximate cause of the expected inflation pick-up but the fundamental driver is monetary buoyancy over 2009-2011. The second “monetarist” forecasting rule employed here, based on the empirical work of Friedman and Schwarz, is that the money supply leads prices by about two years. A smoothed measure of G7 (narrow) money growth fell between autumn 2009 and summer 2010, predicting a decline in inflation between autumn 2011 and summer 2012 – see chart below and post last year. The money measure, however, rose strongly in late 2010 and 2011, signalling that inflation would rebound in late 2012 and trend higher in 2013 – see January post. The money measure is a centred 23-month moving average so the latest available datapoint is for August 2011. The pick-up in the G7 money measure from 2010 partly reflects a US monetary surge caused by the Fed’s QE2 operation. US money growth has slowed more recently but an offsetting recovery is occurring in the Eurozone, while the Fed is poised to launch more bond-buying. The smoothed money measure, therefore, is likely to continue to rise into 2012, in turn suggesting that the inflation uptrend will be sustained into 2014. The measure is already above its previous high reached in 2009, consistent with G7 inflation exceeding its September 2011 peak of 3.1% during 2013.
The monetarist inflation-forecasting approach has had remarkable success in recent years yet is completely ignored by a consensus wedded to failed Keynesian “output gapology” and its convenient implication that central banks must continue to inject liquidity into markets by financing the deficits of fiscally-irresponsible governments.
Are global business surveys bottoming?
A recent contraction in G7 industrial output was signalled by a mid-year plunge in the purchasing managers’ new orders index. The last PMI datapoint in the chart is for July, with an August reading awaiting tomorrow’s US ISM results.
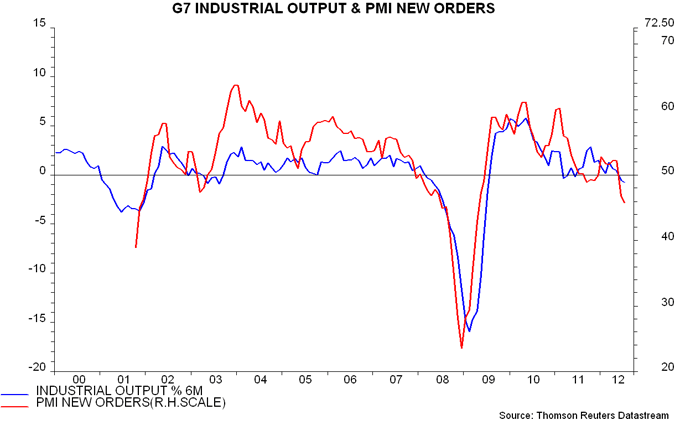
Output weakness, however, has been focused on Japan and Europe, with the US displaying remarkable resilience. Coming US numbers could disappoint as this gap narrows.

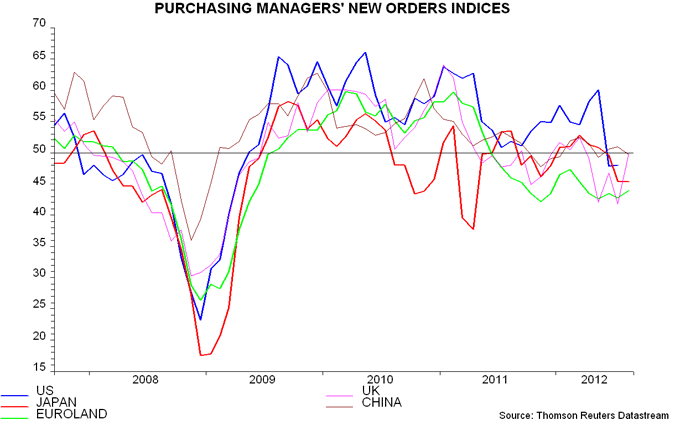
Available August PMI results have been mixed but, on balance, no worse than expected. The UK orders index rebounded sharply and Euroland edged higher, while China and Japan weakened modestly further. The G7 aggregate may be at or near a bottom. It leads output by a month or two, so this would be consistent with the “monetarist” prediction that global momentum will bottom in October / November and revive into 2013 – see previous post.
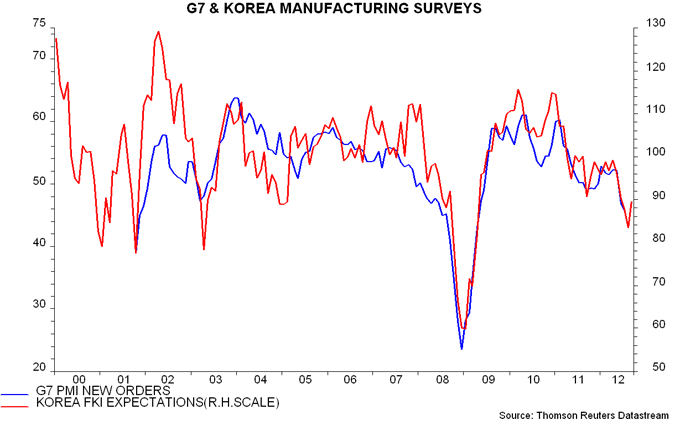
The suggestion that business surveys are tracing out a trough is supported by an uptick this month in the Korean FKI business survey expectations measure, which often moves just ahead of G7 PMI new orders, reflecting the Korean economy’s sensitivity to the global cycle.
Industrial output is preferred here to GDP for the purposes of cycle analysis because it is more timely, frequent and reliable, and correlates better with stock market earnings. The unreliability of GDP numbers is highlighted by the often-large deviations between the expenditure, income and output measures of the concept in early releases. US headline expenditure-based GDP, for example, grew by 0.4% (1.7% annualised) in the second quarter but the alternative gross domestic income (GDI) measure rose only 0.1% (0.6%). This holds out a glimmer of hope to stale bears (ECRI, Hussman etc), since a 2007 Fed study suggested that GDI is earlier to recognise the onset of recessions.
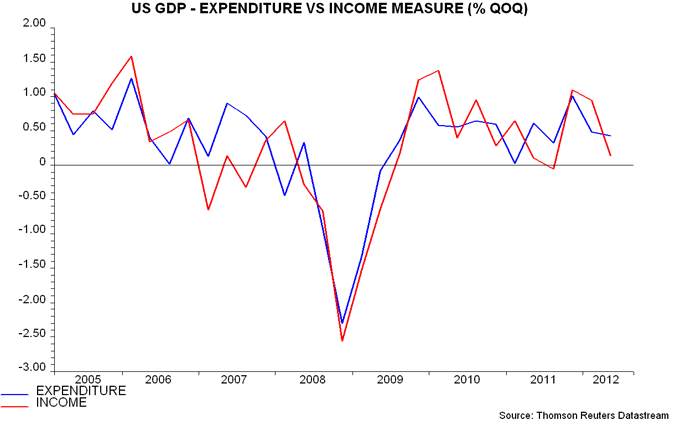
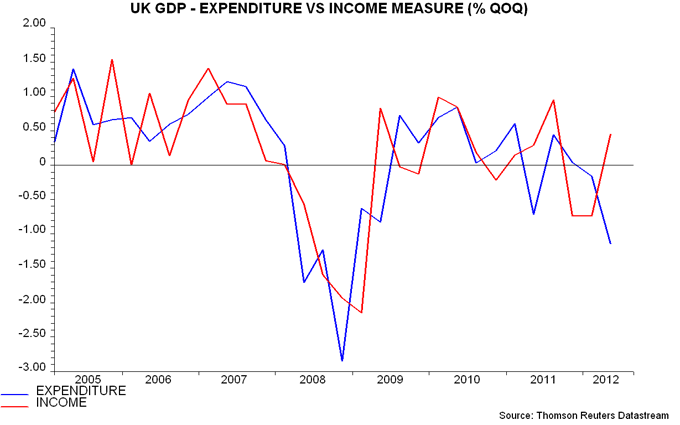
Early UK headline numbers rely on output rather than expenditure or income. The reported 0.5% decline in the second quarter obscures a huge divergence between a 1.1% plunge according to the expenditure measure and 0.5% growth according to the income measure – the latter fits with recent labour market resilience. Take your pick – or, better still, disregard entirely.
