Entries from August 12, 2012 - August 18, 2012
UK leading indicator confirms positive monetary signal
Yesterday’s post explained that the global short-term leading indicator employed here fell at a slower pace in June, consistent with it approaching a late summer trough. The global measure, however, conceals notable divergences across countries. Among the major economies, the UK indicator has firmed while Japan’s has weakened sharply – see first chart.
The suggestion of an improving UK outlook accords with recent stronger real money expansion – six-month growth of real “M4ex” rose to 1.9%, or 3.9% annualised, in June, the highest since April 2009, ahead of a pick-up in economic activity.
The leading indicator implies that manufacturing output will recover during the second half of 2012 – second chart. (Note: May output strength and June weakness reflect bank holiday effects.) This forecast predates the Bank of England’s July decision to expand QE by £50 billion and launch a “funding for lending” scheme on unexpectedly generous terms – these actions will further enhance economic prospects for 2013, though with an associated future inflation cost.
Such considerations may warrant overweighting UK equities in a global portfolio, with a bias towards domestically-orientated FTSE 250 stocks, which usually outperform larger caps after the leading indicator rises – third chart.


Global leading indicator decline slows
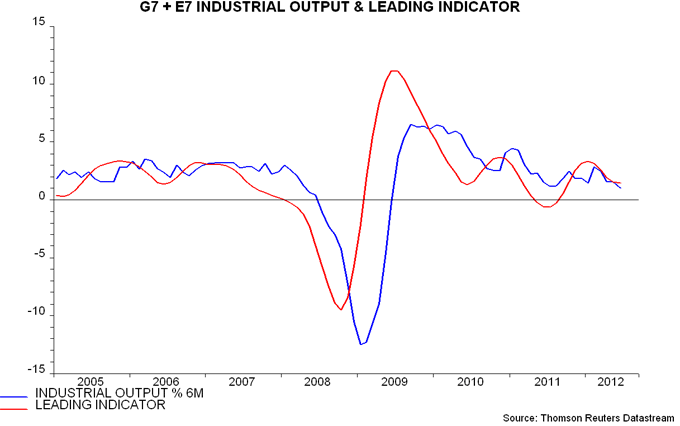
Global economic momentum – as measured by six-month growth of G7 plus emerging E7 industrial output – is expected here to trough in October / November and revive into 2013. This is based on a June pick-up in G7 plus E7 real narrow money expansion, which leads the economy by six months on average – see previous post. (Available information suggests that this pick-up extended in July.)
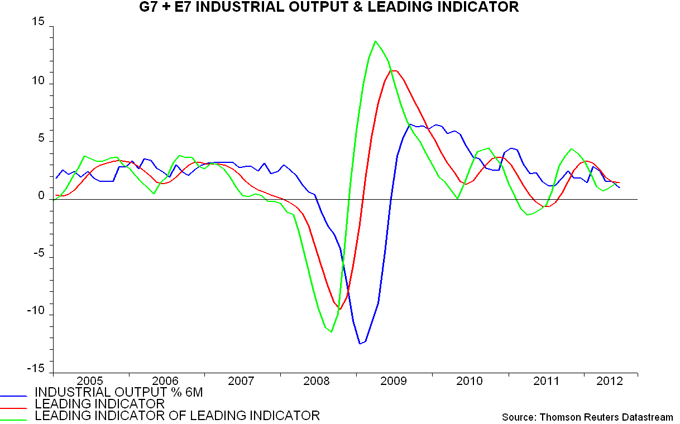
Confidence in this scenario would be strengthened by an upturn in a shorter-term leading indicator of global growth derived from the OECD's country leading indices. This indicator leads the economy by an average of three months so moves about three months after real money expansion. The June pick-up in the latter, therefore, suggests that the leading indicator will rise by September.
The indicator fell again in June, based on OECD data released last week, consistent with economic news weakening further during the third quarter – see first chart. The rate of decline, however, slowed, as would be expected if the indicator were approaching a late summer trough.
The second chart extends this idea, showing an experimental "leading indicator of the leading indicator" – a mathematical representation of its internal momentum. This turns an average of two months before the indicator itself, giving a lead time of about five months to the economy, i.e. similar to real money expansion. It rose slightly in both May and June, suggesting that the leading indicator will increase in July / August – slightly earlier than implied by real money. (Caveat: the "double-lead" measure is sensitive to revisions to the OECD series, making it less reliable in real time than monetary data, for which early estimates are relatively accurate.)
The scenario of a revival in economic momentum from late 2012 requires additional confirming evidence and could yet be aborted by a negative "shock". A key danger is further strength in food and energy prices caused by a combination of supply shortages, stockbuilding related to geopolitical risks and speculative buying in anticipation of more QE; a consequent boost to inflation could reverse the recovery in real money expansion while limiting scope for additional monetary policy easing.


