Entries from July 22, 2012 - July 28, 2012
Odds shortening on UK Bank rate cut
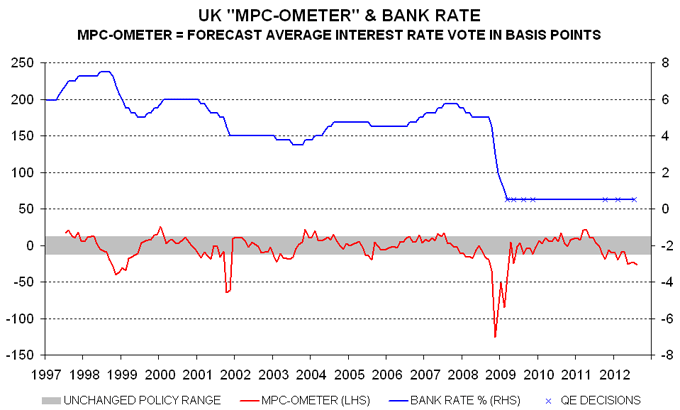
The Monetary Policy Committee is likely to stand pat at next week’s meeting but the “MPC-ometer” model used here to forecast decisions remains firmly in the easing zone, suggesting further action – probably in the form of a cut in Bank rate – over coming months.
The MPC-ometer predicts the monthly policy decision based on the latest values of 12 economic and financial inputs, including business / consumer confidence measures, GDP growth, inflation, wage increases, measures of price expectations, credit spreads and the stock market. Since its introduction in 2006, the model’s forecasting record has compared favourably with the consensus prediction of the monthly Reuters interest rate poll, with periodic “misses” generally due to it moving before the MPC – the model, for example, signalled that “QE3” was likely as early as May.
The model’s output is in the form of the forecast average interest rate vote* of MPC members, with readings of above +12.5 or below -12.5 basis points suggesting a rise or cut respectively in Bank rate. Since Bank rate reached an effective lower bound in early 2009 – at least as judged by the MPC until recently – undershoots of the -12.5 threshold have signalled expansions of QE. The historical performance of the model (estimated on the full data set) is shown in the chart – movements out of the shaded “neutral” zone are usually associated with Bank rate changes or QE announcements.
The last data point in the chart is an August estimate based on data for two-thirds of the inputs and assumptions that 1) tomorrow’s second-quarter GDP estimate shows a fall of about 0.5% (i.e. consistent with a flat economy adjusting for the Diamond Jubilee bank holiday) and 2) components from business and consumer surveys released around month-end are unchanged. The result is another reading below the -12.5 threshold, suggesting further policy easing.
Such action is unlikely next week. The MPC will not wish to amend the announced QE3 programme so soon and will also need time to assess the stimulative impact, if any, of the “funding for lending” scheme (FLS) – the model forecast does not take account of this additional initiative (though will if it translates into improvements in the components, e.g. narrower credit spreads or a recovery in business confidence). The suggestion, however, is that the MPC will be prepared to move again in September if economic and financial indicators remain at current levels.
The most likely next step is a cut in Bank rate to 0.25%. The MPC was previously concerned that this would damage credit supply by squeezing banks’ net interest margins but the cheap funding offered through the FLS is now expected to have an offsetting impact. The possibility of a Bank rate reduction has also been opened up by the ECB’s decision to lower its deposit rate to zero (and official musings about the imposition of a negative rate); this has contributed to recent upward pressure on sterling versus the euro. The MPC, in theory, could lower the rate paid on reserves without cutting Bank rate – thereby protecting banks’ interest income from tracker mortgages – but this looks too complicated and would further weaken linkages between the official rate and market rates.
*For example, if five members want to raise official rates by 25 basis points while four prefer no change, the weighted-average vote is +14 (five-ninths of 25).

Is US velocity plunging?
Current US economic weakness was predicted by a fall in real money supply expansion in late 2011 / early 2012 – see previous post. Real money growth has stabilised recently at a respectable historical level but pessimists argue that this will not prevent a recession because of a decline in the velocity of circulation.
Velocity can be thought of as the flow of GDP income generated by each dollar of the money supply. The pessimists cite the ratio of current nominal GDP to the current M2 money supply in support of their claim; this ratio has plunged since early 2011, reaching its lowest level since 1950 – see chart.
There are, however, two problems with the pessimists’ argument. First, the money supply affects nominal GDP with a lag – of about six months for activity and two years for prices, according to the Friedmanite rule. Velocity, therefore, should be measured by comparing current nominal GDP with the money supply between two and eight quarters earlier. As the chart shows, the ratio calculated using a five-quarter lag – a reasonable compromise – is still above its 2010 low, though may fall as a bulge in M2 in mid 2011 enters the calculation (unless nominal GDP accelerates).
Secondly, velocity should be measured with reference to a broad monetary aggregate that is unaffected by voluntary shifts between different types of account. The M2 surge in mid 2011 was caused by an inflow from large time deposits and institutional money market funds – components of the old M3 definition. The velocity of a broader “M2+” measure incorporating these “wholesale” forms of money – and calculated using a five-quarter lag – has recovered significantly from a 2010 low and may continue to trend higher (since M2+ has been growing much more slowly than M2).
The view here remains that the probability of a US recession in 2012 is higher than in 2010 and 2011 but still well below 50%, based on recent continued expansion of real narrow money.


