Entries from July 15, 2012 - July 21, 2012
Global real money uptick hints at late 2012 economic improvement
 Simon Ward
 Post a Comment
Global economic news is expected here to remain weak during the third quarter, reflecting the lagged impact of a sharp slowdown in real narrow money into the spring – see previous post. Six-month real money expansion in the G7 plus emerging E7 economies, however, stabilised in April / May and appears to have recovered modestly in June, based on early data – see first chart. If confirmed, this recovery holds out hope of a revival in economic momentum in late 2012, allowing for the typical six-month lead.
Caution is still warranted. The final June reading will depend importantly on Eurozone monetary data released next week. The suggested recovery in real money expansion, moreover, mainly reflects a fall in inflation in response to commodity price weakness, which is now reversing – second chart. A sustained pick-up, in other words, will require faster nominal monetary growth – plausible in light of recent policy easing but not guaranteed.
The third chart shows six-month real narrow money expansion for the countries in the global aggregate that have reported for June. The US slowdown paused last month while Brazil’s recovery continued. Policy easing there has been much more aggressive than in China, where narrow money remains weak, suggesting that hoped-for economic reacceleration is unlikely before late 2012 at the earliest.


UK equities: will institutional selling slow?
Direct holdings of UK shares accounted for just 7.7% of the total financial assets of UK insurance companies and pension funds (ICPFs) at the end of the first quarter of 2012, down from a peak of 46.6% in the first quarter of 1998, according to the Office for National Statistics (ONS). Aside from 7.3% at the end of last year, this represents the lowest weighting on record in official data extending back to 1964.
The 39.0 percentage points withdrawn from UK equities over the past fourteen years has been reallocated to bonds (+15.9), mutual funds (+11.2), derivatives (+4.9), long-term loans (+4.4) and foreign equities (+1.8) – see first chart.
A small part of the reduction is attributable to institutions preferring to hold UK equity exposure indirectly via mutual funds. ICPFs’ indirect holdings of quoted UK equities accounted for 62% of their direct exposure at the end of 2010, according to the annual ONS share ownership report. Applying this proportion to the 7.7% of directly-held UK shares at the end of the first quarter suggests total exposure of 12.4% (i.e. 7.7 times 1.62) – still far beneath the historical average for direct holdings.
“Structural” sales of domestic shares by ICPFs may have acted as a drag on UK relative equity market performance in recent years. The weighting will probably fall further but the low absolute level suggests that the pace of selling will, at least, slow. Institutions' cash ratio, meanwhile, is about average by past standards – second chart.


Euro weakness / cost containment boosting peripheral competitiveness
The external labour cost competitiveness of peripheral Eurozone economies continued to improve in the first quarter of 2012, although the gap with Germany remains large.
The charts show real effective exchange rates (REERs) based on unit labour costs, as calculated by the ECB. These measure costs in each country relative to a trade-weighted basket of its competitors within and outside the Eurozone*, expressed in a common currency. The indices are rebased to 100 in the first quarter of 1999, when EMU started.
Pressure for peripheral cost adjustment ratcheted up in mid 2010 after the first Greek crisis / bail-out. In the 18 months from the third quarter of 2010 to the first quarter of 2012, REERs fell by 7.1% in Spain, 5.4% in Greece, 4.6% in Ireland, 2.8% in Portugal, 1.3% in Italy, 0.6% in France and 0.5% in Germany. (All countries benefited from a fall in the euro over the period.)
Spain’s REER is now below its EMU starting level, in contrast to rises in France and the Netherlands.
Peripheral countries, of course, may have locked into EMU with overvalued exchange rates, implying that further downward adjustment will be required to lay the foundation for export-led growth. The REERs, however, dispel the notion that they have suffered a major loss of competitivess relative to core countries – with the obvious exception of Germany.
*The external grouping comprises the 10 non-euro EU member states, Australia, Canada, China, Hong Kong, Japan, Norway, Singapore, South Korea, Switzerland and the United States.
UK headline inflation fall improving economic prospects; "core" still sticky
The surprise fall in CPI inflation from 2.8% in May to 2.4% in June mainly reflects weaker food and fuel prices along with an early start to the summer sales. The latter effect should unwind in July while “good news” on food and energy prices may be nearing an end, with commodity markets rebounding strongly over the past month – the S&P / Goldman Sachs all-commodities index is up by 9.1% in sterling terms.
The annual change in “core” prices, as measured by the CPI excluding unprocessed food and energy, fell from 2.4% to 2.3%, with the decline attributable to the summer sales effect. Smoothed and seasonally adjusted, this index rose at a 2.3% annualised pace in the six months to June – see chart. Core pressures, in other words, remain inconsistent with the 2% inflation target, despite recent economic weakness.
The lower headline rate is improving economic prospects by contributing to a pick-up in real money supply expansion. Real non-financial M4 rose by 2.6% annualised in the six months to May, the fastest since April 2009, suggesting a return to respectable growth during the second half – see previous post.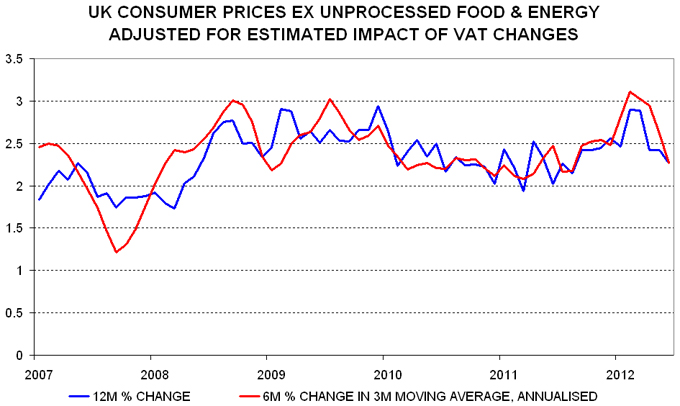
UK house prices: still moving sideways
Previous posts argued that UK house prices were supported by the high level and growth of rents and would probably continue to defy bearish predictions. The “best” value- and volume-weighted measures are the LSL Acadametrics and Land Registry indices, because of their larger sample size and inclusion of cash transactions*. These rose by 3.0% and 0.4% in the 12 months to June and May respectively.
The first chart updates a comparison of five house prices indices, rebased to their respective 2007-08 peaks and seasonally adjusted. The LSL Acadametrics index was only 3.3% below peak in June. Its resilience is confirmed by the Office for National Statistics (previously Department of Communities and Local Government) index, which is also value-weighted and was 3.9% lower in April.
These indices, of course, give greater weight to top-end strength. The volume-weighted Land Registry index, by contrast, was 11.4% below peak in May, though – as noted – has moved sideways over the past year. Its message is confirmed by the Nationwide index, with a shortfall of 12.4% in June, but not the HBOS index, which is down by 18.6%. The HBOS measure has displayed a downward bias relative to the other two volume-weighted indices in recent years, suggesting caution in its use (and explaining its popularity among housing market bears).
Within a larger picture of stability, house prices may soften modestly during the second half of 2012, based on a recent fall in mortgage approvals – second chart.
*A value-weighted index (i.e. giving greater weight to more expensive houses) should be used if the focus of interest is the aggregate value of the existing housing stock. A volume-weighted measure (i.e. giving equal weight to expensive and inexpensive houses) is appropriate if the focus is the price of a “typical” house.