Entries from June 17, 2012 - June 23, 2012
Chinese CPI inflation could fall below 2% by July
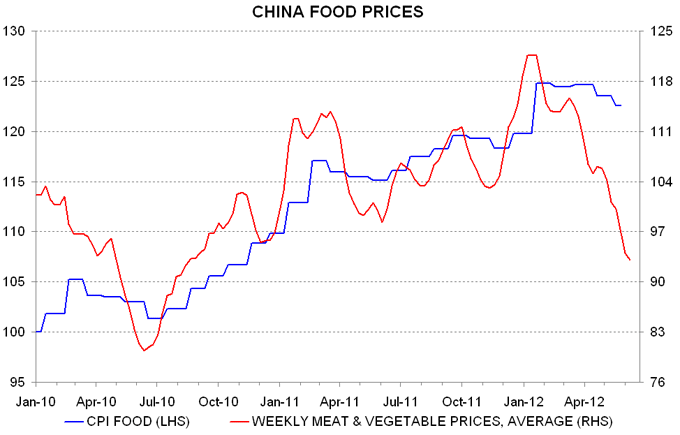
Chinese food prices normally fall in June and July – the average decline in the CPI food index over the two months was 1.5% over 2001-2011. The drop this year could be larger than average, judging from continuing marked weakness in weekly food price data – see first chart.
Supply-side problems contributed to an unusual 2.1% rise in the CPI food index in June / July 2011. If the index falls by 1.5% over the two months this year, in line with the 2001-2011 average, annual CPI food inflation will subside from 6.4% in May to 2.8% in July.
Food accounts for about one-third of the CPI basket, while non-food inflation was just 1.4% in May. Assuming the latter remains stable, a fall in the food component to 2.8% would pull aggregate annual CPI inflation down from 3.0% in May to 1.8% in July.
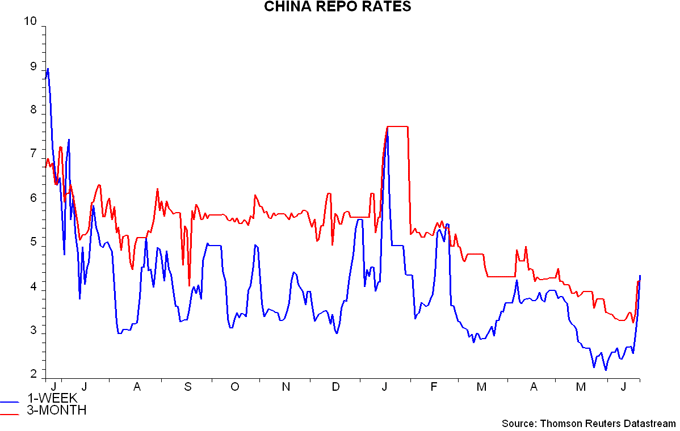
Chinese repo rates have firmed this week, possibly reflecting late quarter liquidity pressures – second chart. With inflation continuing to fall sharply, the authorities are likely to wish to sustain the trend towards easier monetary conditions by announcing an early further cut in banks’ reserve requirements.


How UK fiscal plans could unravel
Public sector net borrowing, on the targeted definition that excludes the temporary effects of financial interventions, peaked at 11.1% of GDP in 2009-10 and fell to 8.3% in 2011-12. This is above the prior post-war high of 7.7% reached in 1993-94. Current government plans entail a cut to 1.1% by 2016-17, according to the Office for Budget Responsibility. This is ambitious but implies an overall adjustment comparable with that achieved in the 1990s and only slightly larger than in the 1970s / 1980s.
The overall tax burden, however, is higher now that at the start of these two prior adjustments. Then, the deficit could be cut significantly by restoring taxes to a normal level relative to GDP. The current non-oil tax share, by contrast, is about average, at 35.1%. Indeed, the historical data suggest that there is a natural limit to the tax share at 35-36% – attempts to raise it beyond this level may run aground on disincentive effects.
The current large deficit reflects overspending not undertaxation. Current expenditure reached a record 42.8% of GDP in 2009-10. The government plans to cut the share by 6.3 percentage points but the process has barely begun and is already generating major opposition. The Thatcher government of the 1980s, admittedly, managed such a reduction but this was against the backdrop of solid economic growth generated by falling interest rates.
A plausible scenario, therefore, is that the government fails to achieve spending cuts on the required scale and tries to compensate by raising taxes further. The tax share, however, refuses to rise so the end result is slower economic growth combined with a stubbornly-high deficit, implying a continued climb in the debt to GDP ratio. Current miniscule gilt yields, suppressed by official and foreign “safe-haven” buying, offer no compensation for the risk of such a scenario.
UK MPC minutes confirm predicted policy shift
The “MPC-ometer” statistical model predicted that the Monetary Policy Committee would ease policy in June, either cutting Bank rate to 0.25% or embarking on a further £75 billion tranche of QE – see previous post. The model was wrong but today’s minutes confirm a major dovish shift – there was serious discussion of a Bank rate reduction, four members voted for an immediate resumption of QE, while others agreed that further easing was likely to be warranted but favoured a tactical delay (pending inflation news, Eurozone developments and the outcome of the Financial Policy Committee meeting in late June).
The latest reading of the “-ometer” – incorporating new data on CPI inflation and average earnings growth as well as market developments and the vote revealed today – is essentially unchanged from just before the June meeting. With the MPC judging a Bank rate cut to have no advantage over more QE, according to the June minutes, a £75 billion extension of gilt purchases seems likely next month, assuming that the Committee does not regard recently-announced liquidity provision measures (i.e. extended collateral term repos and the “funding for lending” scheme) as a partial substitute for monetary easing. A £75 billion programme could be spread over four months to allow a review in conjunction with the November Inflation Report forecasting round.
In the first extended collateral repo conducted today, the Bank of England allotted £5 billion at a clearing spread equal to the minimum 25 basis points over Bank rate. The suggestion that demand for funds was not strong is consistent with the view here that the six-month tenor of the loans limits their attraction for banks facing medium-term funding difficulties – see previous post.
ECB lending to banks still surging
Eurosystem gross lending to banks in euros rose by a further €23.4 billion last week, the largest weekly increase since March, consistent with continued deposit flight from the periphery, especially Greece and Spain – see last week’s post.
A further big rise is likely this week, since €167.3 billion was allotted in today’s weekly refinancing operation versus a maturing €131.7 billion.
Last week’s lending increase was reflected in a €16.8 billion rise in bank reserves (i.e. balances in current accounts and the deposit facility). With reserves also moving higher recently in the US, Japan and Switzerland, the global measure (i.e. G4 plus Switzerland) monitored here has retraced most of its April / May fall – see chart. (See Friday’s post for more on the US reserves rise.)

UK inflation to undershoot BoE forecast but "core" still elevated
The fall in annual CPI inflation from 3.0% in April to 2.8% in May represents a significant favourable surprise that further increases the likelihood of an extension of QE – probably by £75 billion – at the July MPC meeting. “Core” price momentum, however, remains above a level compatible with achievement of the 2% inflation target.
Today’s news together with recent falls in oil and gas prices imply a sizeable undershoot of the Bank of England’s near-term inflation forecast contained in the May Inflation Report. Unleaded petrol has fallen from 142.5 pence per litre in April when the Report was being prepared to 133.6 pence last week. The Bank's assumption that domestic gas and electricity prices will rise by 2.5% during the second half of 2012 now looks questionable. The forecast here is that CPI inflation will average 2.6% in the third quarter of 2012 and 2.4% in the fourth versus the Bank’s projections of 3.15% and 2.93% respectively – see first chart.
“Core” prices can be measured by the CPI excluding unprocessed food and energy. After adjusting for seasonal effects and smoothing using a three-month moving average, this rose by 2.7% annualised in the six months to May, i.e. inconsistent with the inflation target, although six-month growth has slowed from a peak of 3.1% in February – second chart.
This measure of core price momentum is assumed here to stabilise at about 2.5% annualised over the remainder of 2012. This is supported by survey price expectations balances, which are about in line with their averages over the past three years, a period during which core momentum, adjusting for the estimated impact of VAT changes, has run consistently above 2%, averaging 2.4% – third chart.


Global business money growth slowing
Global business money trends are much weaker than a year ago, supporting the view that the current economic slowdown will extend.
The monetary forecasting approach employed here places emphasis on narrow money (i.e. an M1-type measure), partly because of its superior historical performance. Broad money, however, is also monitored, including its sectoral split between households, non-financial businesses and non-bank financial institutions. Non-financial business liquidity is a key driver of investment and hiring.
Annual non-financial business broad money growth in the major economies is currently the weakest since 2009. Holdings have slowed sharply in the US and are contracting in the Eurozone and UK – see chart. Only Japan is displaying resilience.

