
Entries from May 27, 2012 - June 2, 2012
UK real money contraction slows
 Simon Ward
 Post a Comment
The UK monetary backdrop is less weak than a year ago but suggests sluggish economic growth at best.
Recent broad money developments, on first inspection, seem favourable – the Bank of England’s preferred M4ex measure rose by 1.7% in the six months to April while the 12-month increase reached a three-year high of 3.8%. M4ex, however, may have been inflated by UK residents moving funds out of foreign currency accounts into sterling, probably because of worries about the euro. An expanded measure incorporating foreign currency deposits (excluding those held by financial intermediaries) grew by just 0.1% in the latest six months.
Narrow money M1 rose by 0.5% in the six months to April – still soft but better than a 0.9% contraction in the same period a year ago.
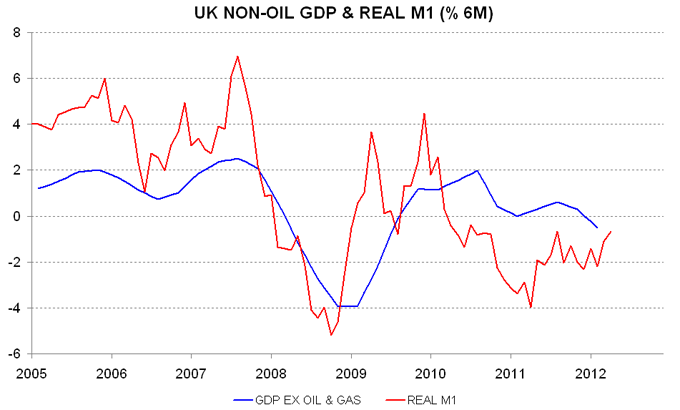
Real money trends have benefited from a significant drop in inflation since then – the year-ago six-month CPI increase was boosted by the January 2011 VAT hike. Real M1 is still falling on a six-month basis but the rate of decline is back to the levels of early 2010 – see chart.
Global real money still slowing
G7 plus E7 six-month real narrow money growth – the key longer-range forecasting indicator employed here – fell further in April, based on data for 11 of the 14 components. Allowing for the typical half-year lead, this suggests that the global economy will continue to slow through October – see first chart.
The six-month change remains respectable – 1.6% or 3.3% annualised – so real money has yet to warn of a recession. A further decline, however, would be worrying.
The hope is that policy easing will lift nominal money growth outside the US, although yesterday’s Eurozone numbers were disappointing. Real money expansion should be supported over the summer by a slowdown in inflation in response to recent falls in oil and other commodity prices – second chart.


Eurozone money numbers: the bazooka wasn't enough
Hope engendered by better Eurozone monetary data for February and March has been dampened by weak April statistics released today. Broad money M3 fell by 0.5% last month after a 1.4% gain in February / March. M1 numbers were still more disappointing, with a 1.1% April decline leaving the measure up by only 0.1% since January.
Real M1 (i.e. M1 deflated by seasonally-adjusted consumer prices) is judged here to be the best monetary leading indicator of the economy – it foreshadowed the current and previous (i.e. 2008-09) recessions as well as the interim recovery, as the first chart below shows. A tentative revival in February / March was wiped out in April, pushing the measure to a new low for the decline that started in September 2010. The suggestion is that the recession will extend into late 2012 while the monetary foundations for a recovery have yet to be laid.
M1 comprises currency and overnight deposits. The ECB releases a country breakdown of deposits but not currency. Weakness, unsurprisingly, remains focused on the periphery – second chart. The six-month change in real M1 (i.e. overnight) deposits is strongest in Austria, Luxembourg, Belgium and Germany and most negative in Greece, Italy and Portugal – third and fourth charts.
ECB President Draghi’s attempt to engineer QE through the back door by funnelling cash to banks for them to buy bonds and onlend may have represented his only feasible option but has failed to deliver sufficient stimulus to offset the contractionary impact of capital flight and an ill-timed regulatory demand to boost capital ratios. The central bank’s “monetary pillar” now demands “full” QE, which should be conducted via purchases of longer-maturity bonds across national markets in proportion to GDP – the ECB’s role is to provide the monetary basis for Eurozone-wide economic growth, not to act as “lender of last resort” to particular governments. The impact of bond purchases on bank reserves can be “sterilised” by auctioning more one-week deposits, if this spares the Bundesbank’s blushes – such an operation is cosmetic since reserves and one-week deposits are fungible. The key requirement is to deliver a direct boost to the broad money supply (hence the focus on longer-maturity bonds more likely to be held by non-banks).


ECB lending boost consistent with ongoing capital flight
Eurosystem gross lending to banks in euros rose by €8.8 billion last week to another new record, consistent with Greek banks continuing to suffer an outflow of private-sector funding (although other explanations are possible).
The gross figure comprises “lending related to monetary policy operations” and “other claims”, under which the Greek and Irish “emergency liquidity assistance” (ELA) operations are recorded. The latter component surged by €34.1 billion last week as Greek banks were moved temporarily off regular support (i.e. “related to monetary policy operations”) onto ELA. The fall in regular lending, however, was smaller, at €25.3 billion, suggesting that either Greek banks accessed additional ELA to cover deposit outflows or institutions in other countries – probably in the periphery – increased their regular borrowing.
The suspicion, therefore, is that system lending to the periphery is continuing to mount, with a corresponding rise in the Bundesbank’s TARGET2 exposure. Will Germany be prepared to keep the liquidity tap open right up until the 17 June Greek election, thereby risking indirectly financing the safe passage of remaining Greek deposits ahead of the possible emergence of an anti-austerity government holding strong cards against its hapless creditors?
Is the yen finally ready to weaken?
A post two years ago suggested that the yen would defy consensus predictions and strengthen further. The tide, however, may now be turning against the Japanese currency.
Consider trade. Higher fuel imports due to the nuclear shutdown contributed to Japan running a visible trade deficit of 1.0% of GDP in the year to the first quarter. This represents the worst performance since 1980-81 both in absolute terms and relative to the US. Movements in the US / Japan trade balance gap have often foreshadowed swings in the dollar-yen exchange rate historically – see first chart.
The impact of trade deterioration on the yen may have been offset until recently by rising real interest rate support – changes in the US / Japan real policy rate spread have also correlated with dollar-yen moves, as the second chart shows. Japan’s advantage, however, is now being eroded by rising prices – April’s CPI was 0.5% higher than a year before. The credibility of the Bank of Japan’s commitment to achieving 1% inflation has been enhanced by recent expansion of its asset purchase programme.
Shorter term, the dollar-yen rate displays sensitivity to the absolute level of US Treasury yields – third chart. Speculators now hold the largest net long position in Treasury futures since January and are often a good contrarian indicator, suggesting a summer rise in yields and accompanying yen weakness.
The main caveat to a yen-bearish view is that the consensus still expects weakness – currencies usually begin major declines when sentiment is at a bullish extreme. Positioning, however, may be modest given the failure of bearish predictions in recent years, a suggestion supported by the latest Merrill Lynch global fund manager survey, showing a lower net percentage judging the yen to be overvalued than in 2010-11.


