Entries from April 15, 2012 - April 21, 2012
Has ECB policy easing failed?
The forecast here that the global economy will retain momentum through mid-year is supported by yesterday’s US Philadelphia Fed manufacturing survey for April and today’s German Ifo poll. The expected new orders balance in the Philadelphia survey – which often leads the national ISM orders reading – remains above average.
German manufacturing expectations, meanwhile, continued to recover in April, reaching a nine-month high. The historical correlation with the Eurozone purchasing managers’ new orders index suggests that the “flash” April PMI survey released on Monday will surprise positively.
The consensus view is that the German pick-up is not representative of the wider Eurozone and will reverse as peripheral recessions deepen. Other indicators, however, are also hinting at an improvement in the Eurozone PMI survey, including equity analysts’ earnings revisions and a leading indicator derived from OECD data.

Renewed weakness in peripheral sovereign bond markets has encouraged claims that the ECB’s interest rate cuts and liquidity injections have been ineffective. The view here is that such a judgement is premature: monetary policy acts with a lag and the latest money supply statistics – for February – do not incorporate even the initial impact of the second, larger three-year LTRO. Eurozone-wide M1 recovered modestly in the latest three months.

UK house prices now undervalued relative to rents
Reader's question: Have you repeated your national-accounts analysis of residential property yields recently? I'm referring to the long-term yield analysis you most recently did here (I think). Just wondering if this has changed at all over the past year. My guess is not (or possibly it's slightly higher). Do you have any thoughts?
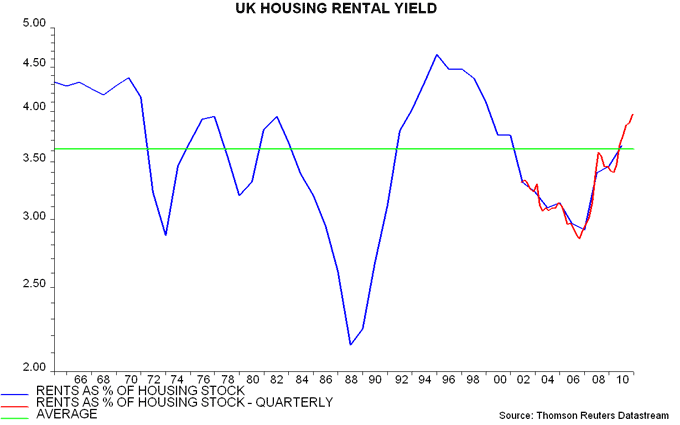
The national accounts rental yield ended 2011 at an estimated 3.97% versus a long-run average of 3.62%, suggesting that house prices are undervalued by about 9% relative to rents – see first chart. The 2011 number is an estimate because ONS has yet to publish an end-2011 figure for the value of the housing stock.
A rise from 3.65% at the end of 2010 reflected an increase of 8.8% in actual and imputed rents last year (i.e. comparing calendars 2011 and 2010), with house prices flat (up by 0.1% between December 2010 and December 2011 according to the DCLG house price index, which is used to revalue the housing stock).
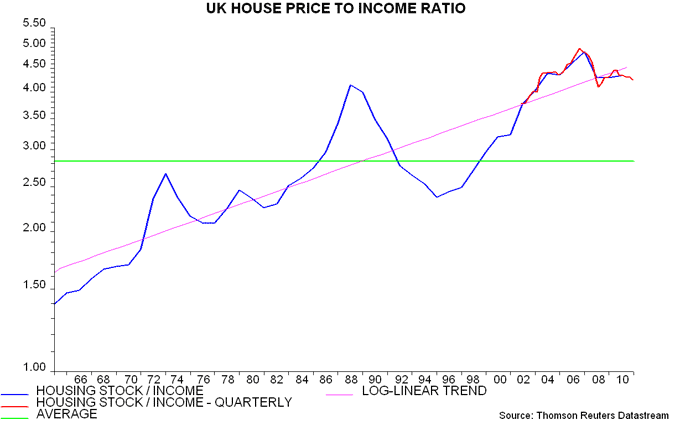
The housing stock to disposable income ratio remains far above its long-term average but is now 6% below its rising trend – second chart. This trend, of course, reflects the same supply / demand factors that have pushed up rents relative to income over the long run.


UK inflation overshoot extends - what's the excuse now?
March CPI figures confirm the prospect of another big Bank of England inflation forecasting miss in 2012. The projection here that CPI inflation will finish the year at about 2.75% may now be too low. This projection implies that December inflation will be above the 2% target for a seventh consecutive year, with a cumulative overshoot of 7.5% since the remit was switched from RPIX to CPI at the end of 2003.
The current overshoot, moreover, cannot be attributed to the various “temporary price level factors” cited by the Bank’s Governor in his unbroken sequence of nine explanatory letters since February 2010, just after a speech in which he suggested a looser interpretation of the remit – dubbed here “inflation targeting lite” and judged to represent an effective raising of the target from 2% to 3%.
March CPI inflation of 3.5% was in line with the consensus estimate but follows a significant “upside surprise” in February. The first-quarter outturn of 3.5% compares with a Bank projection of 3.35% in the February 2012 Inflation Report. A year earlier, the Bank expected inflation to be down to 2.86% by the first quarter (mean forecast based on unchanged policy).
The high reading can no longer be blamed on VAT or other indirect tax effects. The CPI excluding indirect taxes – CPIY – also rose by 3.5% in the year to March.
Part of the overshoot is explained by food and energy prices – CPI inflation excluding unprocessed food and energy was 2.9% in March. This boost, however, appears to reflect domestic pressures in these sectors rather than global commodity price developments. The S&P GSCI all-commodities spot index rose by only 1.2% in sterling terms in the year to March, down from 26.2% in the prior 12 months.
The Bank has also previously cited manufactured import price rises related to sterling weakness as a contributor to the inflation overshoot. The pound’s effective rate, however, rose by 1.5% between March 2011 and March 2012.
The February 2012 Report forecast a fall in CPI inflation to 1.87% in the fourth quarter of 2012 and 1.61% in the first quarter of 2013, based importantly on a slowdown in “core” inflation in response to assumed economic slack and better productivity performance. There is little evidence of such a decline in recent data: the CPI excluding unprocessed food and energy, incorporating adjustments for VAT changes and seasonal effects, rose at a 2.9% annualised rate between the third quarter of 2011 and the first quarter of 2012 – see chart.
The forecast here remains that CPI inflation will finish 2012 at about 2.75%, based on a small easing of core price momentum and broad stability of commodity prices and the exchange rate. Recent core resilience suggests upside risk to this projection.
The vanishing prospect of a return to target this year will be a particular disappointment to the Bank’s leading dove, Adam Posen, who, in a Guardian interview in March 2011, predicted that inflation would tumble to 1.5% by the middle of 2012 and stated that: “If I have made the wrong call, not only will I switch my vote, I would not pursue a second term.”

Global leading indicator yet to confirm real money slowdown
A leading indicator of global industrial output growth derived from the OECD’s country leading indices rose further in February, consistent with economic news remaining firm at least through May. As previously discussed, a fall in global real narrow money expansion since November 2011 suggests that output momentum will slow after May. (Real money typically leads by about six months and the indicator by about three months.)

The message that near-term news will remain satisfactory is supported by equity analysts’ earnings forecast revisions, with more estimates currently being upgraded than downgraded. The “revisions ratio” – net upgrades expressed as a proportion of the total number of estimates – correlates with forward-looking business survey activity measures, such as the PMI new orders index.
Within the global measure, a leading indicator for the “E7” large emerging economies remains stronger than its G7 equivalent, suggesting that emerging equities will sustain their year-to-date outperformance of developed markets. The E7 leading indicator also tends to correlate positively with industrial commodity prices.

The prospect of an economic slowdown later in 2012, as suggested by monetary trends, raises the issue of whether investors should position portfolios defensively. The bias here has been to delay such a defensive shift until the monetary warning signal is confirmed by a fall in the leading indicator. Such a strategy would have been “safe” in recent years; indeed, most significant equity market declines were preceded by the indicator turning negative, not just changing direction.

The liquidity backdrop for markets still seems supportive. Annual growth of global real narrow money remains above that of industrial output, a condition that has historically been associated with equities outperforming cash, as documented in previous posts. (Six-month growth rates, however, have crossed, so the annual calculation may give a “sell” signal later this year.) Aggregate bank reserves in the major economies, meanwhile, have risen to a new record, reflecting a recent injection in Japan.

