
Entries from January 15, 2012 - January 21, 2012
Investor risk appetite reviving but still subdued
 Simon Ward
 Post a Comment
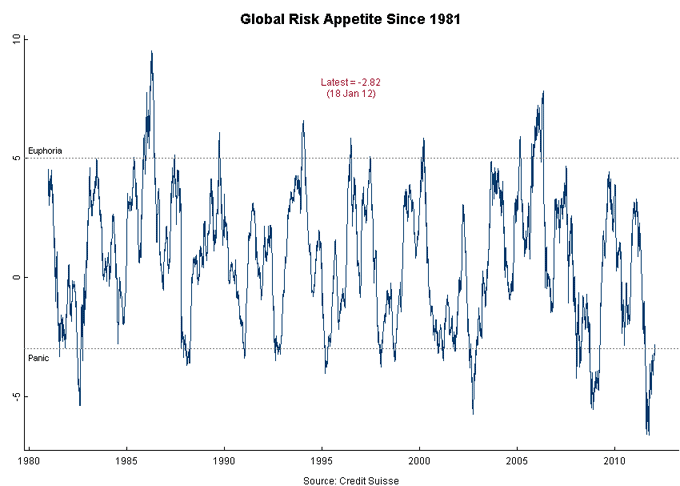
World equities are up by 14% in US dollar terms from their early October low but Credit Suisse’s global risk appetite measure has only just exited “panic” territory – see first chart. On this measure, at least, “risky” assets are not yet overbought.
The Credit Suisse measure remains depressed partly because of the continuing strength of “safe” assets like Treasuries and gilts. A shift of funds out of safe assets into equities etc often marks the final stage of risk rallies. Such a shift has yet to occur.
Treasuries and gilts, admittedly, are being artificially boosted by central bank manipulation in the form of “Operation Twist”, UK QE2 and an extension of existing commitments to maintain rock-bottom official rates.
The combination of unappealing safe government bond yields, plentiful liquidity and a revival in global economic momentum in early 2012 may allow equities to continue to grind higher despite likely further Eurozone woes and other global risks. Even in Euroland, “Maestro” Draghi’s backdoor QE / bank bail-out operation has reduced the potential for negative developments to wreak havoc in markets.
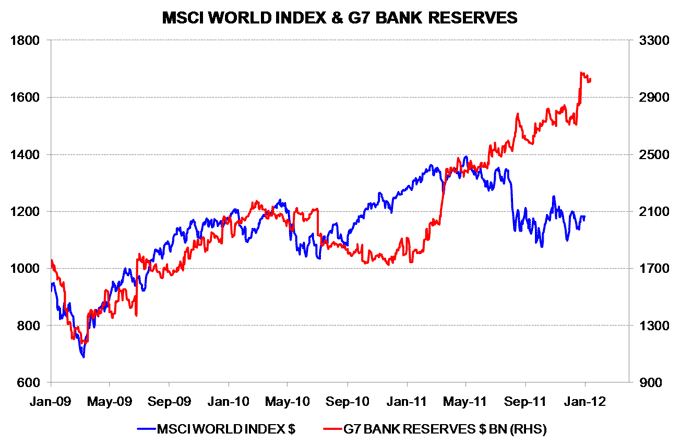
A wide gap has opened up between world equities and G7 bank reserves – second chart. There are many other drivers but the chart conveys an impression of the liquidity “cushion” under markets and the scope for further gains should investors move into full “risk-on” mode.
UK labour market statistics: could be worse
Feared UK job losses did not occur in late 2011, confirming a message of resilience from online job openings – see Monday’s post.
The three-month average of employees in employment stood at 24.79 million in November, the same as two months earlier. This follows a sharp decline last summer – see first chart. Total employment has risen slightly recently, reflecting increased self-employment.
Employee numbers follow the official vacancies series with a lag. The latter continues to flatline, suggesting stable job prospects for early 2012 – first chart.
The bad news in today’s report was a further rise in the labour force survey (LFS) measure of unemployment to 2.68 million in the three months to November. The increase since the summer, however, reflects a combination of growth in the working population and a decline in inactivity rather than reduced employment. The LFS measure, moreover, follows the claimant count, which has stabilised over the last three months – second chart.


UK inflation: stubborn "core" pressures at odds with consensus optimism
UK consumer price inflation fell to an annual 4.2% in December as energy and food prices slowed and the effects of last year’s VAT hike started to drop out of the comparison. A sharp decline in late 2011 had been widely predicted so today's news does not represent a favourable surprise. (A 4.2% end-year headline rate was forecast here in the summer.)
The December CPI print was above 2% for the sixth consecutive year.
The Bank of England’s claim that CPI inflation will fall dramatically during 2012, finishing the year below target, has, like its earlier optimistic forecasts, been accepted by the consensus – the average projection for the first quarter of 2013 is 1.9%, according to Consensus Economics. Such a plunge, however, requires a significant decline in “core” price momentum and / or further weakness in global commodity prices – both doubtful.
The first chart below shows one measure of core prices – the CPI excluding unprocessed food and energy incorporating an attempt to strip out recent VAT effects and adjusted for seasonal factors. The 12-month increase in this measure rose to 2.6% in December, the highest since January 2010. Six-month momentum of smoothed prices was slightly lower at 2.5%, having been stable during the second half of 2011, showing no response to economic weakness.
The six-month momentum measure has remained at or above 2% since January 2008. It failed to rachet lower in the wake of the “great recession” so is unlikely to drop suddenly now.
If core inflation remains resilient, forecasts of a sub-2% headline rate will depend on a big drag from food and energy prices. Food should have a favourable impact but energy and other industrial commodities tend to correlate with emerging-world economic activity, which is now reviving. The second chart shows the six-month change in the Journal of Commerce industrial commodity price index together with a leading indicator for the “E7” emerging economies. The leading indicator has recovered to a level historically consistent with rising raw material costs.
The third chart shows an inflation forecast based on stability in core price momentum and energy prices coupled with a fall in unprocessed food price inflation to 1% by mid-2012. It also incorporates a 0.2 percentage point upward impact from university tuition fees from October. Headline CPI inflation is projected to finish 2012 at 2.6% after reaching an interim low of 2.4% in August.


Chinese economy solid in late 2011
Chinese industrial output numbers for December confirm that the economy regained momentum in late 2011 as the authorities eased restrictions on credit and money expansion.
Six-month output growth was an estimated 6.1% (not annualised) in December, unchanged from November and up from a low of 3.7% in August. (These numbers are based on an attempt to extract a monthly volume index from published value / price data and 12-month volume growth.)
A further pick-up in real money expansion in December, discussed in a post last week, will underpin the economy in early 2012. A leading indicator derived from the OECD’s Chinese leading index suggests steady trend-like growth – see chart.
The main risk to the “soft landing” scenario is that recent monetary loosening will lead to a revival in inflationary pressures later in 2012, forcing the authorities to reapply the brakes.

Bank funding spreads reflecting ECB / BoE divergence
The three-month euro LIBOR / overnight indexed swap spread fell by a further 5 basis points today, confirming that the ECB’s subsidised term lending has succeeded in easing bank funding pressures. The corresponding sterling spread, by contrast, has remained stable, reflecting the Bank of England’s refusal to offer similar support to UK banks.

The premium of the euro over the sterling spread has narrowed from a peak of 45 basis points to 21 today. UK bank stocks outperformed their Eurozone equivalents as this premium widened in late 2011 – the recent closure could signal a reversal of this relative gain.

UK online vacancies holding up
It is anyone’s guess what GDP number official statisticians will manufacture next week but resilient online job demand suggests that the economy flatlined rather than contracted in the fourth quarter.
The chart shows a monthly GDP estimate derived from output data covering services, industry and construction together with a seasonally-adjusted version of the Monster employment index – a tally of online vacancies posted on career websites and job boards (not just Monster’s). Both GDP and the index dipped in October but the latter rallied in November / December, resulting in minimal change for the quarter. This contrasts with a plunge in spring 2008 as the economy entered a recession.
