
Entries from October 23, 2011 - October 29, 2011
Coincident indicators confirm Eurozone contraction
 Simon Ward
 Post a Comment
The EuroCOIN indicator calculated by Banca d’Italia economists and published by the Centre for Economic Policy Research turned negative in October for the first time since September 2009, confirming that the Eurozone economy is contracting in the current quarter, as predicted by an earlier fall in real narrow money.
The indicator is a “real-time, monthly estimate of area-wide GDP growth” based on a wide range of inputs including industrial production, business surveys, stock market and financial data and demand indicators – see here for more. Its in-sample historical performance has been impressive – see chart.
The indicator’s Italian provenance, hopefully, ensures a significant influence on the thinking of incoming ECB President Draghi, thereby enhancing the prospect of needed policy easing at next week’s crucial meeting.

Rescue deal at risk from peripheral monetary contraction
Eurozone monetary statistics for September suggest a deepening recession in the periphery. The ECB must ease aggressively to head off this prospect and prevent a rapid unravelling of the latest rescue package.
The current Eurozone recession, like its 2008-09 predecessor, was signalled in advance by a contraction of inflation-adjusted narrow money M1 – see first chart below. Eurozone-wide real M1 fell by 1.7% (not annualised) in the six months to April 2011, when the ECB locked into recession by raising interest rates, echoing its July 2008 policy mistake.
The six-month change in real M1 moved back into positive territory in July and August, holding out hope that the recession might be short and shallow, involving modest GDP declines in the fourth quarter of 2011 and first quarter of 2012. This prospect, however, has dimmed with today’s September figures showing growth slipping back to just 0.3%.
More worrying still is the country breakdown of M1 deposits – recent growth has been confined to the core with an accelerating decline in the periphery. (The ECB publishes country data on deposits but not holdings of notes and coins.) Aggregate real M1 deposits in Greece, Ireland, Italy, Portugal and Spain fell by 3.4%, or 6.7% annualised, between March and September, the largest six-month decline since February – second chart.
The third chart provides country detail, showing a new extreme in the rate of Greek real M1 deposit contraction – an astonishing 12.2% over six months, or 22.8% annualised. Portugal, meanwhile, appears to have entered a Grecian vortex and monetary trends have deteriorated sharply in Spain, with a six-month decline of 4.3%, or 8.4% annualised. Trends are less awful in Ireland and Italy, suggesting that both are rescuable if the ECB acts sufficiently aggressively.
What is required? An immediate reversal of the quarter-point April and July rate hikes is a minimum but the ECB probably also needs to inject liquidity directly via a UK-style QE programme of sovereign bond purchases, though spread across national markets in proportion to GDPs, in keeping with a monetary policy operation rather than the backdoor fiscal bail-out represented by the current “securities markets programme”.


UK PSNB suggests scope for slower deficit reduction
The UK’s fiscal position is better than stated by the preferred deficit measure, public sector net borrowing excluding the temporary effects of financial interventions (PSNB ex), suggesting that the government has room to introduce modest stimulus measures without undermining longer-term consolidation plans.
PSNB ex amounted to 8.7% of GDP in the 12 months to September, down from 9.3% in 2010-11 and 11.1% in 2009-10. The recent rate of progress suggests that the OBR’s March forecast of a 7.9% deficit in 2011-12 is still achievable, despite economic weakness.
The position, however, looks much better when financial intervention effects are included. The overall PSNB amounted to 6.6% of GDP in the 12 months to September and could fall to 6% in 2011-12.
In cash terms, the PSNB was £30.8 billion smaller than PSNB ex in the 12 months to September. According to a breakdown provided by the ONS, £17.2 billion of this difference was due to the inclusion of the net surplus of the public sector commercial banks – RBS, Lloyds Banking Group (LBG), Northern Rock and Bradford & Bingley. Income from the Asset Purchase Facility (APF) and Special Liquidity Scheme (SLS) accounted for a further £7.9 billion, leaving a residual £5.5 billion – this “other” category includes the net surplus of the banks’ subsidiaries, suggesting that their consolidated contribution was more than £20 billion.
The PSNB includes the entire surplus of the public sector banks but the government’s economic ownership of RBS and LBG is 83% and 41% respectively. A rough calculation based on the accounts of the individual banks suggests that the consolidated surplus actually due to the government was about £13 billion in the year to September. On this basis, “true” net borrowing was about £109 billion or 7.3% of GDP versus PSNB ex of £129.6 billion or 8.7% of GDP.
The surplus of the public sector banks, of course, is not available to finance government spending. With no dividends being paid, however, the surplus results in a rise in the book value of the government’s shares, an increase that should be reflected in the proceeds of the banks’ eventual sale.
The income from the APF and SLS, by contrast, represents cash that is available to finance PSNB ex, reducing the need for market borrowing. The bulk of the £7.9 billion earned in the year to September was due to the APF, reflecting the spread between the running yield of about 4.5% on the Bank of England’s £200 billion gilt portfolio and the 0.5% it pays on the reserve balances created to finance the purchases. The APF surplus will increase further as a result of “QE2”, assuming no change in Bank rate.
A “true” public sector deficit of 7.3% of GDP in the year to September and about 6.75% in 2011-12 is still much too high. However, if the government aimed to reduce this measure to 2.5% by 2014-15 – equal to the OBR’s March forecast for PSNB ex in that year – the implied rate of deficit reduction over the next three years would be about 0.5 percentage points of GDP per annum slower than under current plans, or about £7 billion pa in cash terms. This would accommodate some fiscal slippage due to economic weakness while creating room for modest tax cuts or investment initiatives to boost growth.

Will the UK "double dip"?
Markets remain fearful that the global and UK economies are entering a “double dip”. As discussed in several recent posts, a global recession would be unusual – possibly unprecedented – against the backdrop of recent strength in G7 real narrow money expansion. This strength, however, has been driven by the US and to a lesser extent Japan. Monetary trends remain weak in the Eurozone, where survey indicators are now in recessionary territory – see yesterday’s post.
Will the UK be dragged down by Eurozone contraction? As described below, a monetary forecasting model employed over many years indicates that the probability of a UK recession has risen sharply in recent months but remains below the 50% “trigger” level. On defensible assumptions about the inputs – including, critically, stable global financial conditions – the model predicts that the economy will regain momentum later in 2012.
First estimated in the 1990s, the model is designed to assess the probability of a recession three quarters in advance based on current and lagged values of a range of monetary and financial indicators including short-term interest rates, real narrow and broad money supply measures, the effective exchange rate, credit spreads and share prices*. The chart shows the in-sample performance of the model over the last 50 years. The probability estimate rose well above 50% before the four recessions over this period – 1974-75, 1979-81, 1990-91 and 2008-09.
The recent increase in recession probability started in mid 2010 and was driven initially by a waning of prior interest rate stimulus and slower real money supply expansion, partly due to rising inflation. The pick-up has accelerated over the summer as a result of financial market weakness, reflected in wider credit spreads and lower share prices. Based on the latest input data, the model indicates that a recession is 39% likely by mid 2012.
The model’s forecasting horizon can be extended beyond three quarters by making assumptions about the inputs. An important prospective development is a large decline in inflation in 2012 (albeit by less than projected by the Bank of England), implying a boost to real monetary expansion. Assuming that RPIX inflation subsides to 3.5% while nominal money growth and the other inputs remain at current levels, the recession probability estimate falls back to 25% by mid 2012, consistent with a revival of economic momentum during the second half of next year.
The suggested reacceleration casts doubt on the necessity of “QE2” but this will act as a further stimulus later next year, although at an inflationary cost in 2013-14. Assuming that gilt purchases are limited to £75 billion and serve to boost annual money growth by 2 percentage points, the recession probability estimate declines further to 17% in mid 2012. (£75 billion is equivalent to 4.9% of the M4ex broad money supply measure so a 2 percentage point impact may be conservative, implying “leakage” of nearly three-fifths.)
The recent spike in the estimate will reverse faster if financial markets continue to recover from their summer weakness – possible given the benign global liquidity backdrop but dependent on Eurozone stabilisation. Significant market deterioration would be necessary to push the estimate above 50%, assuming no change in the other inputs – for example, credit spreads would need to double their widening since mid 2011 with equities falling by 10% from current levels.
*A recession is defined here as an annual fall in GDP. This is more stringent than the widely-used “two consecutive quarterly declines” definition, i.e. the probability of a recession in the latter sense will be slightly higher than the model estimate.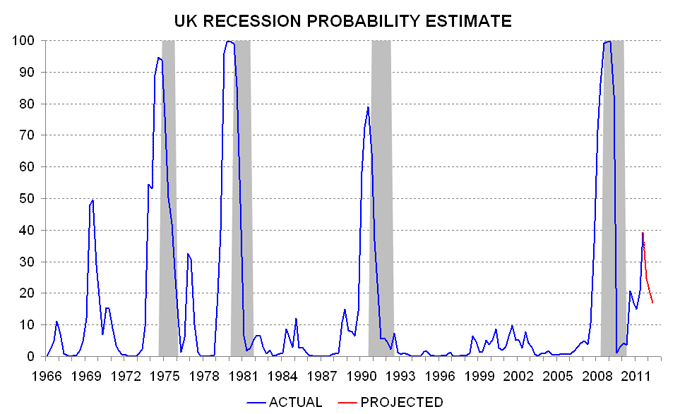
Complacent ECB risks prolonged recession
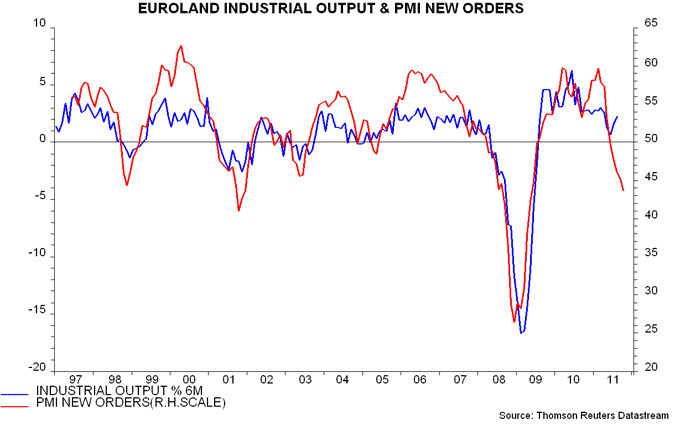
The Eurozone manufacturing purchasing managers’ new orders index fell further to 43.7 in October, a level previously reached on only two occasions since the inception of the survey in the late 1990s, both associated with recessions.
Current economic weakness was foreshadowed by a decline in real narrow money M1 starting in late 2010 and documented in several previous posts. Real M1 contraction has preceded every recession since the mid 1970s (at least).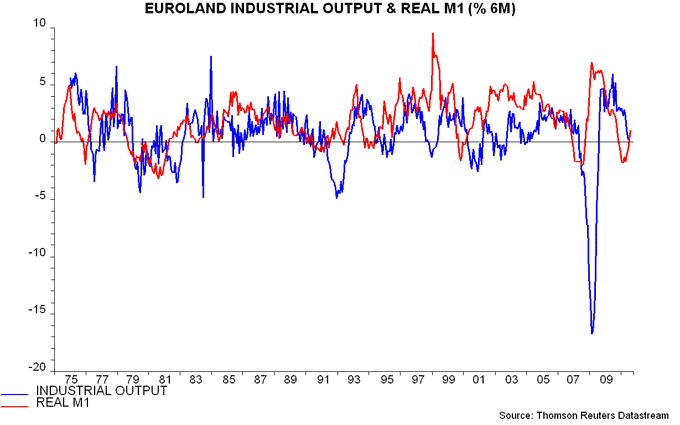 The alarm bells were ignored by the ECB’s chief economist Juergen Stark, supposedly guardian of its “monetary pillar", who led the suicidal charge towards higher interest rates this spring and is now making for the exit as the fruits of his handiwork become apparent.
Real M1 has recovered recently, increasing by 1.1% (not annualised) in the six months to August. The end of previous recessions, however, has been signalled by six-month growth rising to at least 2%. It is doubtful, moreover, that the pick-up will be sustained given financial market weakness and ECB inertia.
Sig. Draghi, in other words, needs to overrule the hawks and cut interest rates swiftly to head off a prolonged recession that would undermine any rescue package concocted this week.
