Entries from October 2, 2011 - October 8, 2011
Pull the other one, Gov
Talk about selective use of statistics. Bank of England Governor Mervyn King has defended the decision to launch QE2 on the grounds that “the amount of money in the economy fell over the last year”. He is referring, presumably, to the 0.6% decline in the M4 broad money measure in the year to August.
However, the Bank’s own monetary analysis, presented in the Inflation Report and updated in the monthly minutes, is based on the “M4ex” measure, which strips out deposits of financial intermediaries. The exclusion is justified because the money holdings of such institutions are unrelated to economic transactions. M4ex rose by 2.2% in the year to August.
M4ex, however, understates available liquidity because it excludes foreign currency holdings and public sector money substitutes. Foreign currency deposits rose by 7.0% in the year to August, perhaps reflecting money-holders diversifying away from sterling as the MPC effectively abandoned its inflation target.
The Governor should stop pretending that the MPC is concerned about monetary weakness. QE2 has been launched in response to double dip fears and as a quid pro quo for the coalition sticking to its deficit-cutting plans. The MPC has demonstrated no ability to forecast inflation so its claim that action was required to prevent an undershoot should be treated as propaganda.
Rules-based policy-making has been replaced by 1970s-style discretionary fine-tuning driven largely by political considerations – a recipe for continued sterling weakness and stagflationary malaise.
MPC puts sterling at risk
The Monetary Policy Committee’s decision to launch a further £75 billion of gilt purchases to be completed over four months was in line with the prediction of the “MPC-ometer” and the recent steer from well-connected FT commentators – see previous posts here and here.
£75 billion is equivalent to 3.7% of a broad liquidity measure comprising the “M4ex” aggregate plus private-sector holdings of foreign currency deposits, Treasury bills, National Savings instruments and DMO repos. This rose by 4.5% in the year to August, up from 0.9% in the prior 12 months – hardly suggestive of an intensifying monetary squeeze requiring an offsetting official cash injection.
The monetary effect of the coming gilt purchases is likely to be greater than earlier rounds because banks and companies are in better financial shape. The earlier injection was partly “extinguished” by bank capital-raising exercises and corporate loan pay-downs.
With no obvious shortage of money in the economy, “excess” liquidity created by QE2 should support asset prices and push down the exchange rate. Today’s action, indeed, risks triggering a major further fall in sterling, echoing the 1976 collapse when UK monetary policy was similarly lax – see chart. Such weakness would damage growth prospects by boosting import prices and sustaining a high-inflation squeeze on hard-pressed consumers.

Would a US recession crush stocks?
“Based on evidence that has always and only been observed during or immediately prior to US recessions, the US economy appears headed into a second leg of an unusually challenging downturn.” So wrote economist and fund manager John Hussman in his weekly market comment of 28 June 2010 (link to left). The US economy, of course, continued to expand during the second half of last year, with GDP rising at a 2.4% annualised pace.
Mr Hussman issued another recession call this summer. So has Nouriel Roubini, who forecast a “double dip” in 2009 as well as 2010 (and was “predicting” the 2008-09 recession as early as 2006). They have been joined recently by the highly-respected Economic Cycle Research Institute, which has never issued a false recession forecast.
So is a US contraction now a done deal? While making no claims of recession-spotting omniscience, the author of these notes judges that the economy was at “stall speed” in September, reflected in a near-50 reading of the ISM manufacturing new orders index, moderately significant corporate earnings downgrades and soft labour market indicators. A further negative shock could tip it over into recession. Perhaps the financial turmoil in Europe is sufficient cause.
A recession now, however, would be very unusual from a monetary perspective. As discussed in a post questioning Mr Hussman’s 2010 recession call, 10 out of 11 post-war US downturns were preceded by a contraction of the real narrow money supply. The exception was the 1953-54 recession, apparently caused by severe fiscal tightening as defence spending was slashed after the Korean war.
Monetary growth, moreover, has been accelerating strongly recently, on both narrow and broad measures, with corporate liquidity particularly buoyant. The typical six-month lag suggests that the economy will regain momentum from early 2012, if not sooner. At a minimum, ample liquidity should limit any near-term decline in spending and activity.
Any downturn, therefore, should be mild and short-lived. This consideration is probably more significant than whether the recession-mongers are right or wrong. A modest two-quarter contraction in GDP could be met by relief by markets fearful of another “great recession”. A comparison can be drawn with 1990-91, when GDP fell by 1.4% over the winter quarters but the S&P 500 ended the recession 5% higher than when it started – see first chart.
Such a scenario, by the way, would be consistent with the continued rather remarkable adherence of US stocks to the “six-bear average”, which is about to hit a bottom and embark on a gradual but sustained uptrend – second chart.


UK GDP revision implies even bigger productivity plunge
Revised GDP figures show that the 2008-09 recession was significantly deeper than previously thought, implying an even bigger “productivity puzzle” – the apparent mismatch between severe output weakness and a relatively modest loss of employment.
GDP is now estimated to have fallen by 7.1% between the first quarter of 2008 and the second quarter of 2009 versus a previous 6.4% decline between the same starting quarter but a later trough in the third quarter of 2009. The subsequent recovery has been marginally stronger than in the earlier data – 2.8% rather than 2.7% by the second quarter of 2011 – so the latest level of GDP is 0.5% lower than previously thought, relative to the pre-recession peak.
The chart compares the new and old data together with the path of GDP in the previous three recessions and recoveries. Relative to the peak, GDP in the second quarter of 2011 was 1.6% below the level at the same stage of the recovery in the early 1980s, which followed the second worst recession in the post-war period, involving a 5.9% GDP decline.
The “productivity puzzle” can be illustrated by a comparison with the 1990-91 recession, when GDP and employment (labour force survey measure) fell by 2.5% and 6.3% respectively from peak to trough. While the reported decline in GDP in 2008-09 was nearly three times that in the early 1990s, the employment loss was much smaller, at 2.5%.
A case can be made for excluding oil and gas production when making cross-recession comparisons – rising North Sea output moderated the fall in GDP in the early 1980s. On the revised figures, gross value added excluding oil and gas started to decline one quarter earlier than overall GDP, though bottomed in the same quarter (i.e. the peak occurred in the fourth quarter of 2007, as Northern Rock was imploding). The peak-to-trough drop was 7.1% versus 6.3% over 1979-81. Relative to the peak, non-oil output in the second quarter of 2011 was 0.8% below the level at the same point of the early 1980s recovery. Employment, however, fell by 6.5% over 1979-83.
Some apparent “good news” in today’s figures is an upward revision to average GDP growth in the decade preceding the recession, from 2.8% annualised to 3.1%. This, however, seems mainly to reflect a decision to switch from retail prices to consumer prices in deflating nominal consumer spending. It is debatable whether this represents a methodological improvement, particularly as it has not been possible to implement the change for earlier decades when the CPI was unavailable, thereby distorting long-term GDP growth comparisons.
Why are Fed "reverse repos" falling?
The weekly Fed balance sheet report contains a line item “reverse repurchase agreements, foreign official and international accounts”. This represents cash placed with the Fed by overseas institutions against collateral in the form of Treasury and other securities.
These reverse repos surged after Lehman’s collapse in September 2008 and from the start of August this year as the Eurozone sovereign and banking crisis intensified. A possible explanation is that these events prompted foreign central banks managing official reserves to withdraw funds from US / European banks and place them with the Fed on "safe haven" grounds. The reverse repos, in other words, may serve as an indirect gauge of banking system funding stress.
Consistent with this interpretation, the reverse repos have correlated negatively – with a slight lead – with the relative performance of European financial stocks, as shown by the chart below.
The reverse repos peaked in early September and have fallen for three consecutive weeks, though remain historically high. The decline may be connected with the 15 September announcement of three-month US dollar liquidity-providing operations to be conducted by the ECB, Bank of England, Swiss National Bank and Bank of Japan over year-end, financed by currency swaps with the Fed. This announcement may have eased concerns about European banks’ dollar funding difficulties, thereby reducing reserves managers’ desire to hold cash at the Fed.
While European financial stocks have weakened further since early September, they have stopped underperforming.
A less encouraging possibility, however, is that the fall in the reverse repos, rather than reflecting a reduction in banking system stress, has been due to foreign central banks running down their Fed cash in intervention operations to support their currencies against a strengthening US dollar. Still, the deployment of Fed-held cash boosts US bank reserves and the monetary base.
A further decline in the reverse repos, therefore, would be a hopeful signal for markets.

Are US junk bonds signalling a recession?
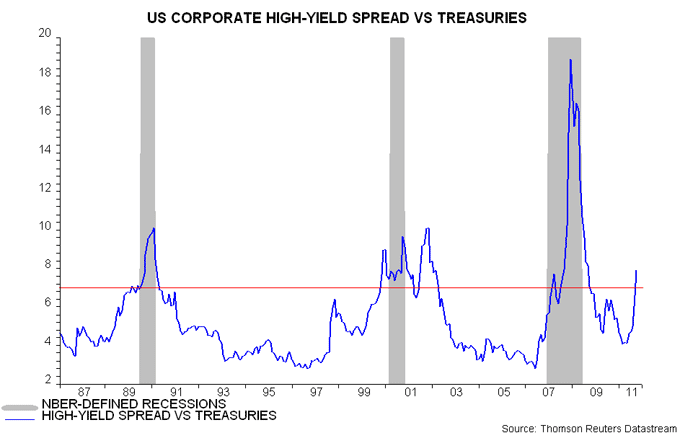
The yield spread of US corporate high-yield bonds over Treasuries has risen above seven percentage points, a level that signalled recessions in 1990, 2000 and 2008:

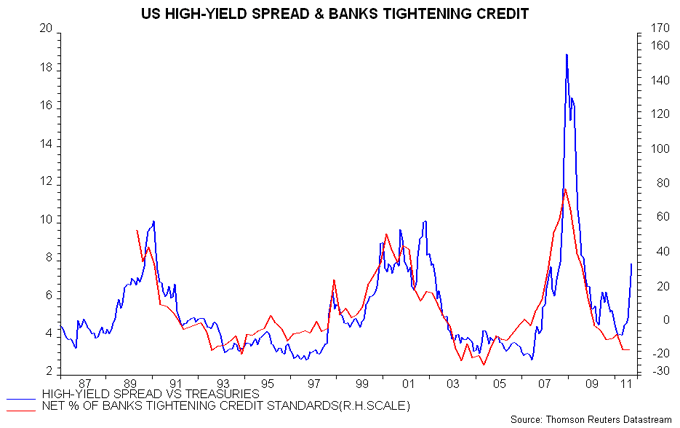
The spread, however, correlates with the net percentage of banks tightening credit standards on commercial and industrial loans, as reported in the Fed’s senior loan officer survey. As of July, the latter indicator was towards the bottom of its historical range, consistent with a much lower level of the spread. The net tightening percentage would need to surge in the October survey, released in November, to restore a normal relationship between the two series:
A similar divergence occurred in 2002 as high-yield bonds sold off with equities on fears of a “double dip”, while the Fed indicator remained stable. The economy was weak but avoided another recession, with the spike in the high-yield spread fully reversed in 2003.
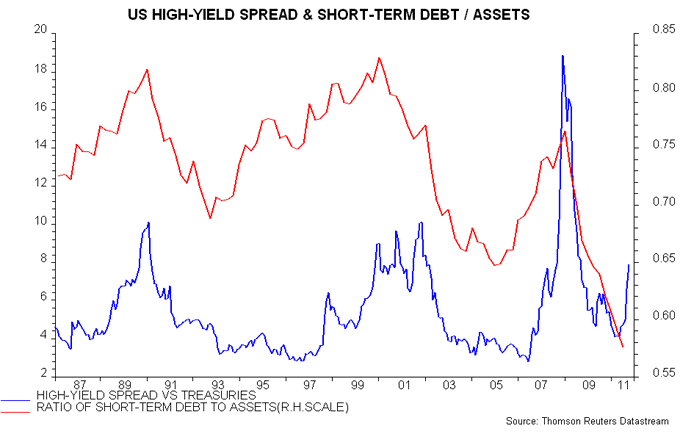
The recent rise in the spread also sits oddly with improving corporate liquidity. Non-financial business money holdings rose by 15% in the year to June – see previous post. The high-yield spread, historically, has usually narrowed when the ratio of short-term debt to assets* has fallen:

The surge in the spread has probably contributed to US recession calls by several prominent forecasters. The high-yield market, however, may have been “infected” by increased risk aversion due to the sovereign debt crisis, temporarily weakening its relationship with corporate and economic fundamentals.
*Short-term debt including trade payables divided by sum of liquid assets, trade receivables and inventories.

