
Entries from January 10, 2010 - January 16, 2010
Liquidity positives for equities
 Simon Ward
 Post a Comment
First, the annual rate of change of G7 real money supply M1 remains far above that of industrial output. As detailed in a previous post, world equities have outperformed dollar cash by 11.1% per annum on average when this condition has been met. Real money growth, however, could cross below output expansion this spring – see first chart.
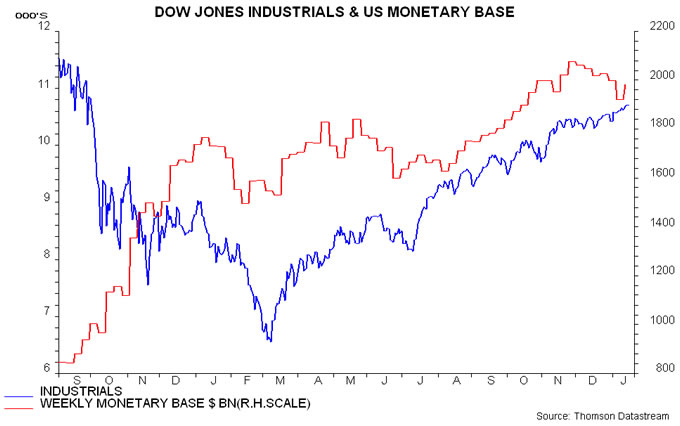
Secondly, the US monetary base, having fallen in late 2009, is rebounding – second chart. A Wall Street Journal article last year by Andy Kessler argued that changes in the Fed's liquidity policy, reflected in the monetary base, were driving equities and other markets. The decline from late November was the result of a build-up of cash in the US Treasury's "general account" at the Federal Reserve, partly due to repayments of TARP funds; this reduced banks' reserves at the Fed. The Treasury, however, is now deploying this cash, reversing the impact: the general account balance rose from $13 billion on 25 November to $167 billion on 6 January but had fallen to $124 billion by 13 January.
Thirdly, US Treasury yields have fallen since the start of the year as investors have pushed back expectations for Fed tightening in the wake of last week's December employment report. The two-year yield is down by about 25 basis points.
Fourthly, US retail interest in equities remains muted but could pick up as economic news continues to improve. Equity mutual funds suffered a further outflow in December and early January, in contrast to substantial – but slowing – buying of bonds.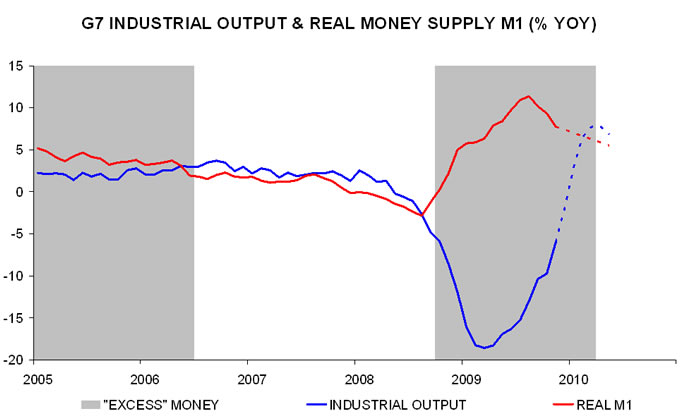
UK housing recovery continuing; prices boost to Xmas sales
Some commentary has claimed that this week's Royal Institution of Chartered Surveyors (RICS) survey for December signals renewed housing market weakness. Hardly. The survey suggests a slowdown in price gains – unsurprising given a 14% annualised rise in the Halifax index over the last eight months – but a further increase in turnover.
True, the buyer enquiries index has fallen significantly from its peak in June last year. It remains, however, firmly in positive territory, consistent with further gains in mortgage approvals and transactions – see first chart. The new instructions index, meanwhile, has picked up recently but is still below buyer enquiries, suggesting that demand continues to outstrip supply.
Commentators have also interpreted the British Retail Consortium (BRC) December sales survey, showing a rise in annual sales growth from 4.1% to 6.0%, as evidence of a pick-up in consumer spending. The increase, however, may have been due to higher inflation rather than stronger volumes – the annual gain in the BRC's shop price index accelerated from 0.2% to 2.2% in December.
Manufacturing output figures for November, released today, were disappointing, showing no increase from October. Relative to its pre-recession peak, however, UK output is at a similar level to France and higher than in Germany, Japan and Italy – second chart. In other words, the smaller recent recovery in the UK partly reflects a less severe prior decline.

US employment leading indicators improving
Markets were mildly disappointed by December US payroll numbers released on Friday, showing a monthly fall of 85,000, but the Conference Board's employment trends index (ETI) continues to signal a labour market recovery.
The ETI is designed to lead turning points in payrolls and has eight components: consumers' assessment of job availability, initial unemployment claims, small firm unfilled vacancies, temporary employment, involuntary part-time working, job openings, industrial production and business sales. It bottomed in June last year, edging higher into the autumn before rising strongly in November and December. All eight components contributed to last month's gain – more details here.
Historically, the index has led troughs in payroll employment by between one and four months – see chart. The June bottom was, therefore, consistent with a low in payrolls by October. They increased marginally in November before slipping back in December. The ETI suggests that last month's decline will be either revised away or more than offset by a rise in early 2010.
Strong global momentum at end-2009
The OECD's leading indices are designed to predict industrial production and typically lead by three months or so. November figures released on Friday show further large gains across major developed and emerging economies. A combined G7 plus "E7" indicator suggests that output will continue to recover rapidly in early 2010 – see first chart.
Further evidence of resurgent industrial activity is provided by recent Asian trade data. The second chart shows combined dollar exports and imports of China, Korea and Taiwan, adjusted for seasonal variation. Both surged in December, with imports surpassing their July 2008 peak.


