
Entries from September 1, 2019 - September 30, 2019
Euroland PMIs: darkest before the dawn
 Simon Ward
 Post a Comment
Euroland September flash PMI results were disappointing but monetary trends continue to give a hopeful signal for economic prospects.
The expectation here has been that the manufacturing PMI would bottom out around Q3, reflecting a recovery in real money momentum from late 2018. Instead, the index fell to a new seven-year low in September – see first chart.

Weakness was again focused on Germany, where the PMI has undershot its low during the 2011-12 Euroland recession; the French index, by contrast, continues to hold above 50. The German results, however, were questioned by the September Ifo manufacturing survey (which has a much larger sample size): the orders inflow balance and the rate of change of the finished goods inventories balance held above their recent lows – second chart. These balances are components of the OECD’s German composite leading indicator.

The ECB, meanwhile, today reported further hefty monthly gains in narrow and broad money in August. Six-month growth of real M1 and M3 (i.e. deflated by consumer prices, seasonally adjusted) rose to the highest levels since 2017 and 2016 respectively – third chart.

The headline measures have been boosted by faster growth of deposits held by financial institutions, which may reflect portfolio shifting in response to negative yields and have little implication for spending on goods and services. The forecasting approach here focuses on non-financial M1 and M3, comprising money holdings of households and non-financial businesses: six-month real growth of these measures remains well up on a year ago, though has not risen further recently.
The country breakdown of M1 deposits show that real growth remains strongest in France – consistent with recent resilience in coincident economic data – and has picked up sharply in Italy, suggesting improving prospects. German growth continues to lag but remains solid.

Will the resumption of QE give a further boost to monetary trends? Scepticism is warranted: the announced programme is small – equivalent to 2.0% of GDP per annum – and liquidity created by earlier QE was largely exported, resulting in little impact on M3.
US financial accounts confirming narrow money weakness
The Federal Reserve last week released its Q2 financial accounts, containing detailed information on sectoral financial activity. Key takeaways include: 1) the “best” narrow money measure is giving a negative signal for near-term economic prospects, 2) corporate equity-buying has normalised after the boom due to foreign profits repatriation and 3) debt levels of non-financial businesses and households converged in Q1 and remained equal in Q2 – business debt was consistently lower over 1992-2018.
The sectoral data in the financial accounts permit calculation of non-financial M1, the preferred narrow money aggregate here. This comprises M1 holdings of households and non-financial businesses – headline monthly M1 includes foreign and financial sector holdings, which are less relevant for assessing prospects for spending on goods and services.
Swings in two-quarter real (i.e. deflated by the CPI) non-financial M1 momentum lead swings in two-quarter GDP momentum – see first chart. Real money momentum fell sharply between Q4 2018 and Q2 2019, suggesting a GDP slowdown into Q4 2019 or Q1 2020.

Net equity purchases by non-financial corporations boomed in 2018 and early 2019 as tax changes encouraged a one-off repatriation of foreign retained earnings and company managers prioritised share buy-backs over business expansion and / or reducing debt. The reflux of foreign profits, however, ended in H1 and equity-buying fell sharply in Q2 – second chart.

Sustained strength in equity purchases, even before the 2018-19 boom, has been a key driver of a rise in non-financial business debt since 2012. Business debt converged with household debt in Q1 and both grew at a similar rate to nominal GDP in Q2 – third chart.

A stabilisation of equity purchases, even at the lower Q2 level, would imply a further rise in business debt. Low mortgage rates, however, are stimulating household credit demand and could lead to a recovery in the debt to GDP ratio. A cross-over of the two ratios – the business ratio was last higher in 1991 – could, therefore, be deferred.
Global money data still weak
Global six-month real narrow money growth appears to have been little changed in August, suggesting a further extension of weak economic prospects into Q2 2020.
August monetary data have been released for the US, China, Japan, India and Brazil, together accounting for two-thirds of the G7 plus E7 aggregate tracked here. August CPI numbers, meanwhile, are available for all countries bar the UK and Canada*. Assuming unchanged money growth / inflation rates for missing countries, G7 plus E7 six-month real narrow money expansion is estimated at 1.6% versus 1.5% in July – see first chart.
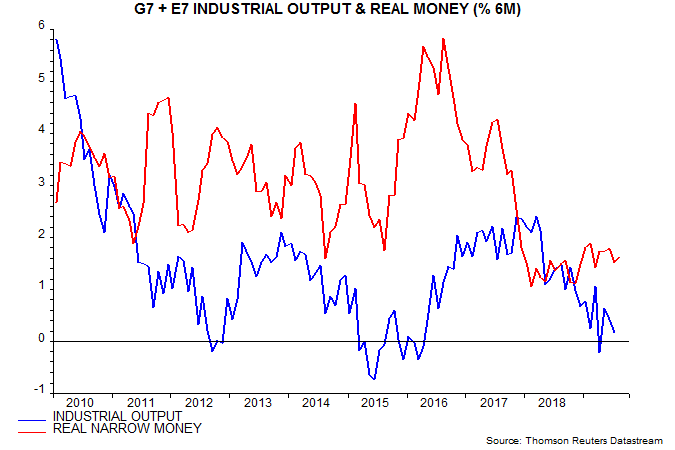
Real money growth remains well below the 3% level judged to be consistent with an economic recovery. A fall below 1% would suggest a full global recession.
The small August change conceals a partial recovery in China after a sharp July drop, offset by a US relapse to zero – second chart. The Fed’s Q2 financial accounts out on Friday will provide further information about US monetary trends, including sectoral details and data necessary to calculate M3**. Japanese real narrow money growth was little changed in August, while Euroland / UK data will be released on 26 / 30 September.

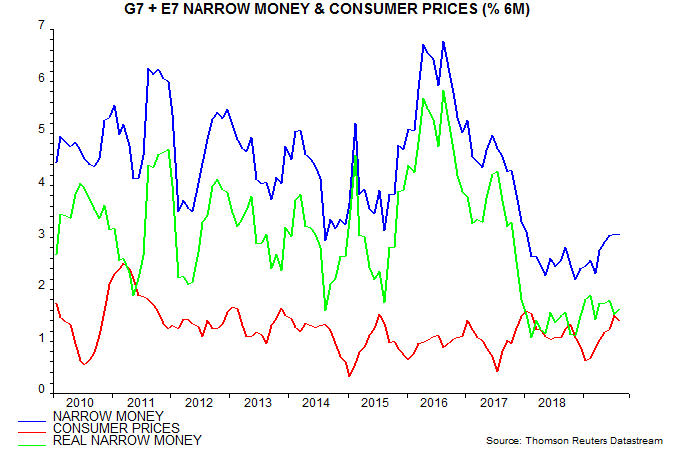
Global six-month real narrow money growth reached a high for the year of 1.9% in February. The slippage since then reflects a pick-up in six-month consumer price inflation, which has offset a modest rise in nominal money expansion – third chart.
Will the jump in oil prices since the weekend result in a further inflation squeeze on real money growth, pushing it down to the 1% recession warning level? The fourth chart projects forward the six-month rate of change of the GSCI commodity price index in US dollars assuming that the index remains at Monday’s level, which was 8.0% up from Friday. The relationship with G7 plus E7 six-month CPI inflation suggests that the latter will moderate in the very near term before rebounding to slightly above a July high around end-2019.
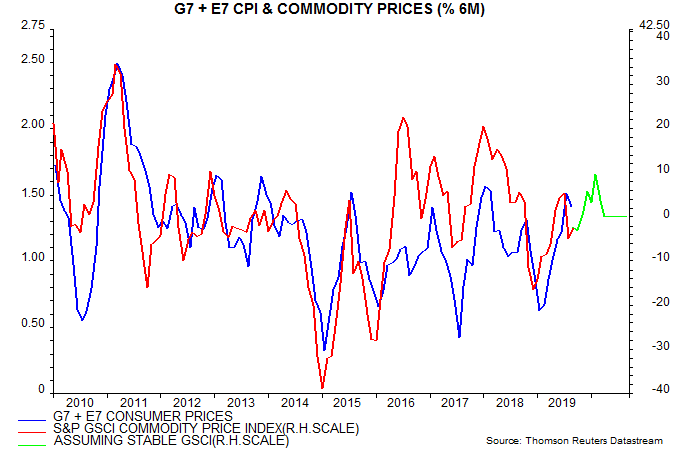
The oil price rise, therefore, makes an early rise in global real narrow money growth to the 3% recovery level less likely but would need to extend significantly further to generate a recession warning.
*Tokyo only for Japan.
**Some analysts claim to be able to calculate M3 from available monthly data but the methodology involves estimation and potential double counting.
US core CPI inflation: fade the pick-up
US annual CPI inflation excluding food and energy rose to 2.39% in August, the highest since 2008. Is the pick-up in core inflation long predicted by Phillips curve adherents finally materialising?
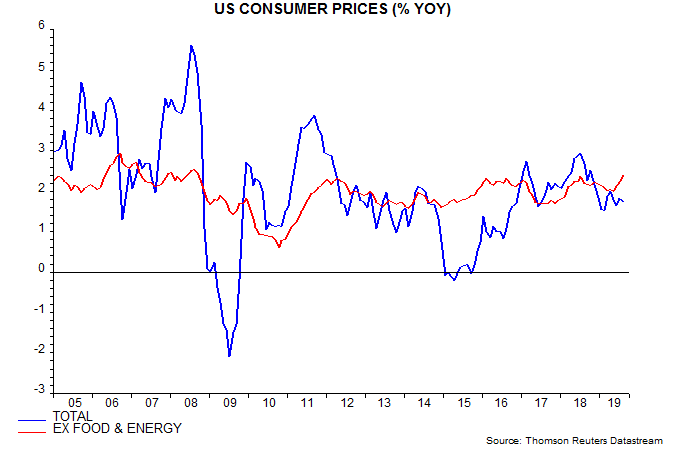
A detailed examination suggests not. The ex. food and energy measure has been pushed up by the goods and medical care components – second chart. The goods rise partly reflects tariff effects while the medical care component has been boosted by surging health insurance costs – up by 18.6% in the 12 months to August.
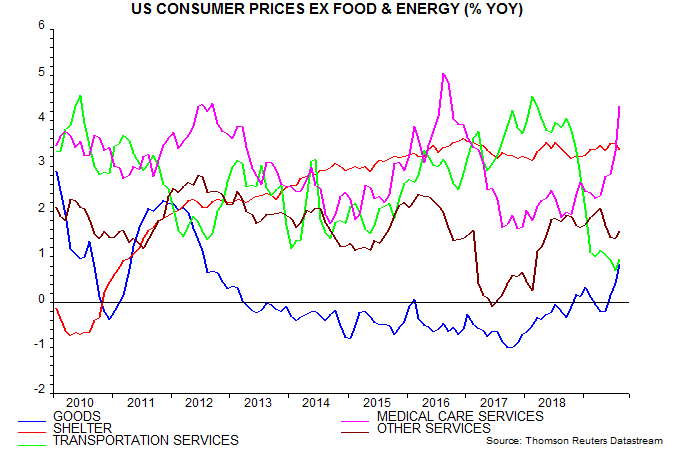
The health insurance component of the CPI is an indirect measure based on insurers’ retained earnings – current strength partly reflects a fall in pay-outs. The equivalent component of the Fed’s favoured price gauge, the personal consumption expenditures index, is much weaker, rising an annual 1.4% in July.
Hikes in tariffs and health insurance costs represent “cost-push” inflation and are demand-deflationary.
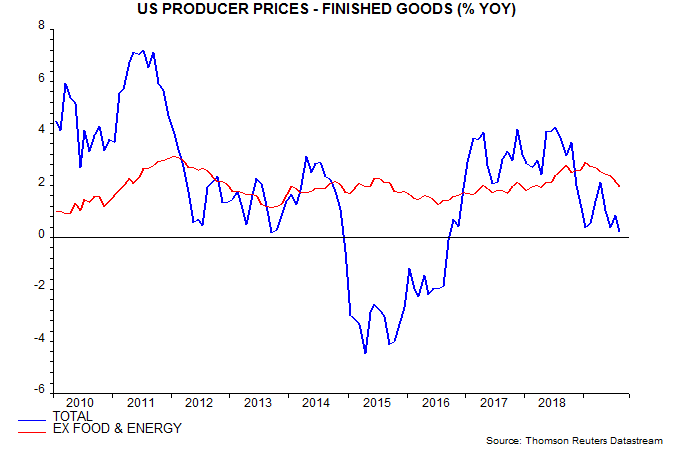
Producer price data signal weakening core goods pressures: annual finished goods inflation ex. food and energy peaked in January and fell further in August – third chart.
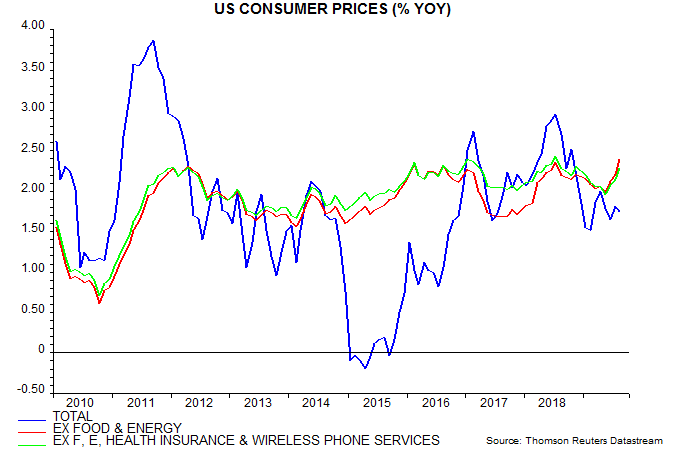
The current boost to the CPI from the tiny health insurance component recalls an even larger drag from the similarly-small wireless phone services component in 2017 – their current weights are 1.2% and 1.6% respectively. The fourth chart shows a measure of core CPI inflation excluding both components – this has been significantly less volatile and remains within its recent range.
Labour market watch: global vacancies weakness
UK labour market trends remain consistent with the view here that the economy has entered a recession.
This view was seemingly undermined by Monday’s news of a 0.3% monthly rise in GDP in July. The monthly numbers, however, are volatile and revisions tend to be downwards when the economy is weakening – at the start of the 2008-09 recession, GDP was initially estimated to have risen by 0.2% in Q2 2008 but is now reported to have declined by 0.7%.
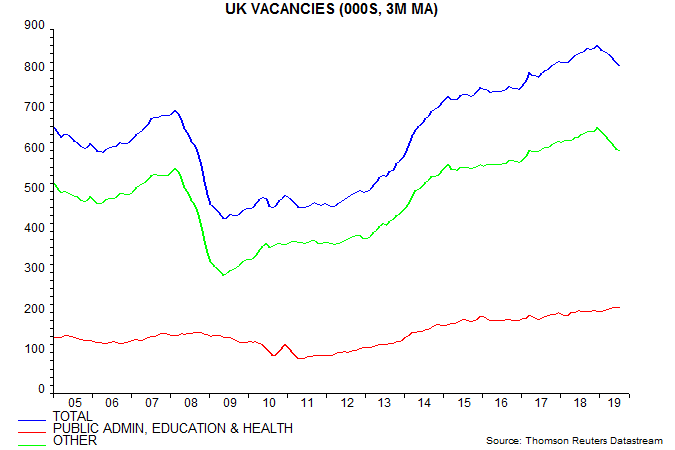
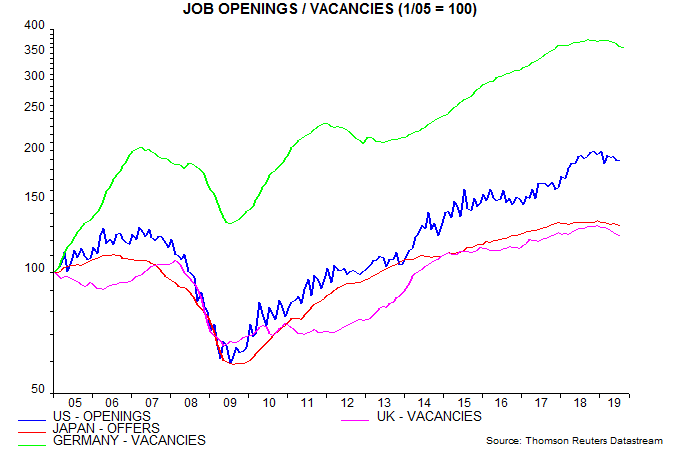
Aggregate hours worked, measured on a three-month rolling basis, fell by 0.4% between April and July. Such a three-month decline is not unusual but a further drop in the stock of vacancies suggests that weakness will extend – see first chart.

The percentage fall in vacancies is now similar to a decline before the 2011-12 double dip scare. Weakness then was due to public sector job cuts but the current reduction is being driven by private employers, suggesting that it reflects contracting activity (as opposed to fiscal consolidation) – second chart.
Vacancies or job openings / offers are now falling simultaneously in the US, Japan, Germany and UK for the first time since the 2008-09 recession – third chart.
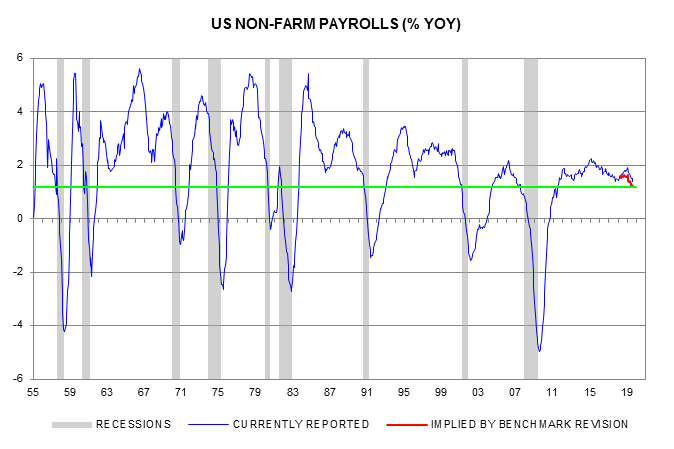
Annual growth of US non-farm payrolls fell to 1.4% in August, the lowest since 2017. Current data, however, do not incorporate a BLS estimate that the payrolls rise between March 2018 and March 2019 was overstated by 501,000 – revised figures will be issued in February 2020. Assuming that monthly payrolls changes between April 2018 and March 2019 were 42,000 (501,000 divided by 12) lower than currently reported, the “true” annual growth rate for August was 1.2%. Since the mid 1950s, falls in annual payrolls growth to this level have occurred only in the context of recessions – fourth chart.
Global momentum bottoming, not turning: investment thoughts
August PMI results are consistent with the long-standing expectation here that global industrial momentum would bottom around Q3 2019 but narrow money trends have yet to signal an economic recovery. Turning points in industrial momentum are usually associated with a rotation in financial markets but the still-weak economic outlook suggests that any such change will be muted or delayed.
Global manufacturing PMI new orders were little changed for a second month in August, while order backlogs reversed a July fall – see first chart. The new orders-inventories differential – regarded as a leading indicator – dropped back but remains above a March low. These developments hint at a stabilisation of industrial momentum following an 18-month slide.

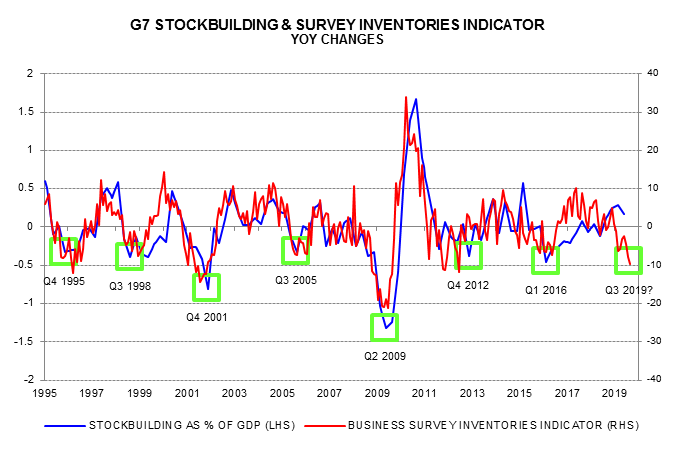
The view that momentum would reach a trough around Q3 was based partly on the stockbuilding cycle, which has an average duration of 3 1/3 years and last bottomed in H1 2016. The cycle is illustrated by the second chart, showing the contribution of stockbuilding to the annual change in G7 GDP. This was still positive in Q2, suggesting that the cycle downswing could last for several more quarters before reaching a trough.

Business surveys, however, are signalling a major inventories downdraft during H2 – the third chart shows a survey-based measure that correlates with and sometimes leads the GDP stockbuilding data. This indicator has fallen to levels consistent with a cycle low, which may be confirmed – after the event – by the GDP data for Q3 / Q4.
The reasons for doubting that a low in industrial momentum associated with a trough in the stockbuilding cycle will be followed by an economic recovery are 1) global real narrow money growth remains weak and 2) the business investment cycle remains in a downswing and may not bottom until H1 2020.
On 1), global six-month real narrow money growth fell back in July and early indications for August are disappointing – US weekly numbers have been weak and global six-month consumer price inflation appears to have remained elevated.
On 2), a trough in the investment cycle is usually marked by the annual change in G7 business investment turning significantly negative and undershooting the annual change in real operating profits, which recovers first. Based on Q2 data, these conditions may not be met for several more quarters – fourth chart.

Financial market trends typically reverse around stockbuilding cycle troughs. The table shows that the pattern of returns during the current cycle downswing – assuming a Q3 trough – has been similar to an average of seven previous cycles. In particular, US equities and quality stocks have outperformed, emerging markets have been under pressure, the US dollar has strengthened and Treasury yields have fallen.
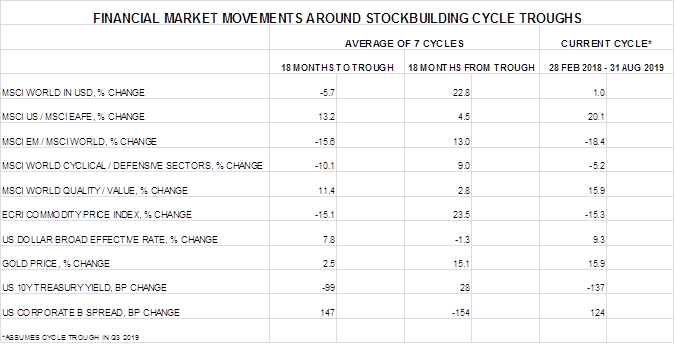
A view that the stockbuilding cycle is bottoming would normally imply that investors should rotate portfolios in favour of international / EM equities, value stocks, foreign currencies, commodities and credit, while reducing exposure to defensive US / quality equities and “safe” bonds. With an economic recovery likely to be delayed, however, such a shift could be premature.
Global equities, unusually, have risen during the current stockbuilding cycle downswing – an additional reason for thinking that defensive trends in markets may be incomplete.
A possible approach is to adjust exposure to areas that have already out- or underperformed by more than average for stockbuilding cycle downswings while retaining an overall cautious strategy. This would suggest, for example, reducing US / quality in favour of EM and value equities while retaining an underweight in cyclical sectors.
There is also a case for focusing a portfolio shift in countries / regions, such as Euroland, where money growth has picked up convincingly, implying an earlier economic recovery.
