
Entries from September 1, 2015 - September 30, 2015
UK broad liquidity accelerating, supporting rate rise case
 Simon Ward
 Post a Comment
Broad liquidity holdings of UK households and non-financial firms are growing at the fastest pace since the 2008-09 recession, supporting optimism about economic prospects and strengthening the case for an early interest rate rise.
The Bank of England’s preferred broad money aggregate, M4 excluding money holdings of “intermediate other financial corporations” (M4ex), rose by an annual 3.9% in August, in line with the average since the start of 2014 – see first chart. Its growth, however, has been depressed by two factors unlikely to be of economic significance. First, money holdings of financial corporations have fallen by 4.3% over the past year, cutting M4ex growth by an arithmetical 0.6 percentage points. This reflects a decline in bank deposits held by fund managers* and securities dealers, and has little implication for spending in the economy.**
This suggests focusing on M4 holdings of households and non-financial firms, or “non-financial M4”, rather than M4ex. Annual growth of non-financial M4 was 5.3% in August, the fastest since July 2013 – first chart.
Secondly, the annual rise in household M4 has been lowered by large-scale switching into National Savings products. The 12-month inflow to NS was a record £21.8 billion in August, mainly reflecting heavy buying of high-interest pensioner bonds on offer from January until one week after the May general election. Such bonds, and other NS products, would be included in M4 if issued by a bank rather than the government. This argues for adding together non-financial M4 and outstanding NS when judging the broad liquidity position of households and non-financial firms. This expanded measure grew by an annual 6.3% in August, the fastest since June 2008 and well above an average of 3.7% over 2010-14 – first chart.
The positive message from broad liquidity is reinforced by still-solid narrow money trends. Non-financial M1, comprising notes / coin and sight deposits of households and non-financial firms, grew by an annual 7.6% in August – second chart.
Bank credit expansion is lagging money growth – the usual cyclical pattern – but is firming, with forward-looking indicators positive. M4 lending to households and non-financial firms rose by an annual 1.9% in August, the fastest since May 2009 – second chart. Mortgage approvals totalled £19.6 billion in August, the highest since April 2008. Excluding remortgages, approvals were £12.9 billion, almost matching a peak of £13.0 billion in January 2014 associated with a rush to beat new tougher mortgage rules. Meanwhile, sterling unused credit facilities – another leading indicator – grew by an annual 4.1% in August, with a notable pick-up in recent months***.
*Insurance companies / pension funds, investment / unit trusts and other fund managers.
**The fall may also be of limited significance for asset prices, since it may have been offset by a rise in financial institutions’ holdings of other liquid assets: the outstanding stock of DMO repos and Treasury bills increased substantially in the year to August.
***16.1% annualised rise over latest three months.


Eurozone money trends still positive but little QE impact
A pick-up in Eurozone narrow money (M1) growth from spring 2014 signalled that economic expansion would strengthen while deflationary risks were receding. Recently-revised national accounts data confirm this scenario. GDP grew at an annualised rate of 1.7% between the third quarter of 2014 and the second quarter of 2015, up from 0.7% in the prior three quarters. Domestic inflation, as measured by the annual increase in the GDP deflator, bottomed at 0.7% in the second quarter of 2014, rising to 1.2% a year later.
Note that the monetary pick-up was under way well before the ECB began to discuss QE in late 2014. Rather than QE, interest rate cuts in June and September played a key role, with their impact possibly magnified by the ECB supplying long-term liquidity tied to lowered official rates via its TLTRO programme.
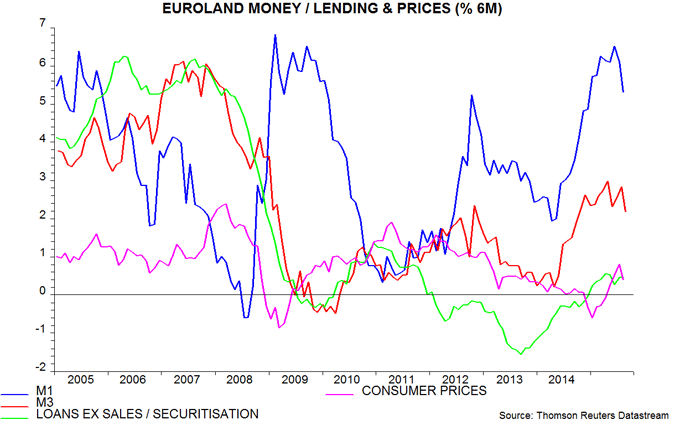
Monetary trends continue to give a positive message for economic prospects, although August changes were softer than in recent months. M1 rose by 0.3% on the month while the broader M3 measure was unchanged. Both aggregates, however, had increased sharply in July and six-month growth rates remain solid, at 5.3% and 2.2% respectively, or 10.9% / 4.4% annualised – see first chart.
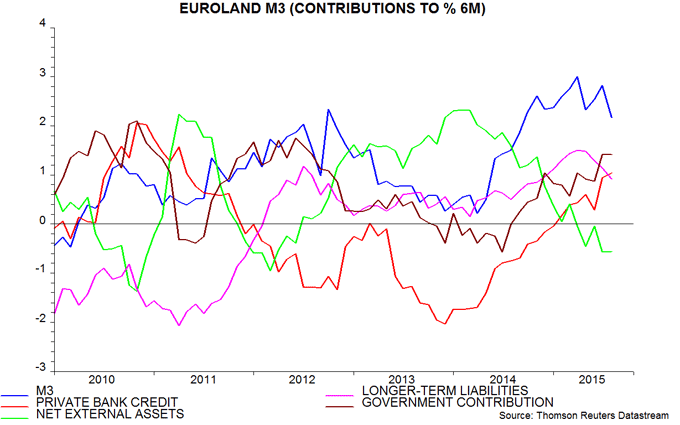
Previous posts on UK and Japanese experience argued that QE had little impact on monetary growth, because it triggered offsetting changes in private sector behaviour – in particular, sales (or reduced buying) of government securities by banks and an increase in net non-bank capital outflows (i.e. some liquidity flowed overseas). The evidence to date suggests that the current ECB programme is proving similarly ineffectual: six-month M3 growth of 2.2% in August compares with 2.6% in February, just before QE started. The M3 counterparts analysis confirms a drag from capital outflows: the impact of changes in banks’ net external asset position on six-month M3 growth has moved from +0.1 percentage points (pp) in February to -0.6 pp in August – second chart. In addition, banks sold €51 billion of government securities in the six months to August versus purchases of €41 billion in the prior six months.
Respectable economic growth, reviving inflation and still-positive monetary trends argue against further policy easing. If it were required, there is little reason to believe that additional QE would be effective.
UK GDP revisions to show stronger recovery
GDP revisions to be published by the Office for National Statistics (ONS) on 30 September will reveal significantly stronger growth in recent years, helping to explain the “productivity puzzle” and confirming that the double / triple dip scares of 2012 and 2013 were wide of the mark.
The ONS has already indicated the scale of revisions up to the fourth quarter of 2013; the 30 September release will extend the process to the present. The currently-available numbers show that the recovery was weaker than previously thought in 2010 but significantly stronger over 2011-2013. GDP is now estimated to have risen by a cumulative 6.0% between the fourth quarters of 2010 and 2013, equivalent to 2.0% at an annualised rate, versus a prior 4.2%, or 1.4% annualised.
GDP surpassed its pre-recession peak in the second quarter of 2013, one quarter earlier than previously thought.
GDP growth in calendar 2013 has been raised from 1.7% to 2.2%. The consensus at the time was for a sub-1% outcome, with much talk – notably from the IMF – of the risk of a recession (in contrast to the positive view taken here).
The end-September release may extend the upward revisions to growth since the fourth quarter of 2013. Even if the quarterly path since then is unchanged, however, the upgrades to earlier data imply that the GDP increase in calendar 2014 will be raised from 3.0% to 3.3%.
The revisions reflect a combination of methodological changes and new data. According to the ONS, the biggest impact has come from measures to improve coverage of small business activity and capture income concealed by tax evasion. The revisions could affect sectoral financial balances (i.e. income minus spending); as previously discussed, the household sector is currently estimated to be running a deficit.
The revisions are unlikely to alter MPC thinking: the direction, if not the scale, was expected and the MPC will attribute most of the upgrade to better supply-side performance, implying little change to its estimate of slack. They are potentially more significant for fiscal policy, since they may result in the Office for Budget Responsibility (OBR) raising its estimate of trend GDP growth, in turn boosting revenue forecasts. The scale of fiscal adjustment needed to meet targets, therefore, may be smaller than the OBR judged at the time of the July Budget.

Is the consensus wrong about US / Chinese economic prospects?
Economists expect stronger US growth next year but a further slowdown in China. The average forecast for US GDP growth in 2016 is 2.7%, up from 2.3% in 2015, according to Consensus Economics. Chinese GDP expansion, meanwhile, is projected to fall from 6.9% to 6.7%. Given a widespread belief that GDP data are manipulated, the consensus probably expects a larger decline in actual Chinese growth.
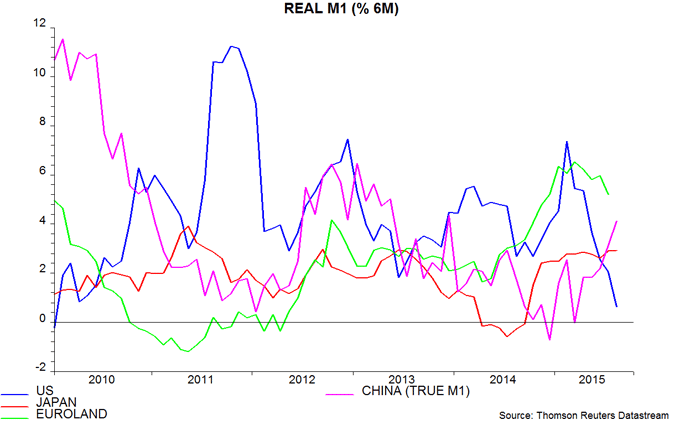
Narrow money trends, however, are giving an opposite message for economic prospects. Six-month growth of US real (i.e. consumer price-deflated) M1 fell to 0.6%, or 1.3% at an annualised rate, in August, the lowest since January 2010. Chinese real “true” M1* growth, by contrast, rose to 4.1%, or 8.3% annualised, a 20-month high – see chart.
Narrow money signals have provided valuable insights in both countries in recent years. US six-month real M1 growth fell in summer 2014 ahead of an economic “soft patch” in early 2015. It rebounded strongly around end-2014, predicting faster economic expansion over the summer / autumn: GDP rose by 3.7% annualised in the second quarter. Chinese real true M1, meanwhile, contracted during the second half of 2014, forewarning of recent economic weakness.
Narrow money is a leading indicator because the demand to hold it is influenced importantly by spending intentions. The US M1 slowdown suggests that households and firms have turned more cautious and are scaling back their plans, possibly temporarily, ahead of expected Fed policy tightening. The Chinese pick-up, by contrast, is evidence that monetary and fiscal policy easing is gaining traction by lifting confidence and spending intentions.
Chinese M1 strength contradicts claims that domestic liquidity would contract as a result of foreign exchange intervention to support the currency (“quantitative tightening”). Such claims amount to treating Chinese monetary arrangements as a pure currency board, ignoring the panoply of tools available to the authorities to offset intervention effects on the monetary base and money holdings of households and firms.
If the message of current narrow money trends is correct, US GDP growth will, once again, fall short of the consensus forecast in 2016, suggesting limited pressure for Fed rate hikes. A rebound in China, meanwhile, should support global economic expansion. Such a combination could imply a favourable backdrop for markets. Additional US M1 weakness, however, or a relapse in China, would be concerning.
*True M1 = official M1 plus household demand deposits. Official M1 = cash in circulation plus demand deposits of corporations and government organisations. Annual true M1 growth rose to 8.9% in August from a low of 2.0% in March.
UK job openings suggesting further pay pick-up
UK pay growth is picking up strongly, consistent with the historical relationship with the job openings or vacancy rate*, a measure of labour market tightness. This relationship suggests a continued upswing through mid-2016, at least.
Average weekly regular earnings (i.e. excluding bonuses) rose by 3.2% in the year to July, the largest annual increase since 2008. Private sector growth was 3.7% versus only 1.1% in the public sector – the recent gap is the largest on record in data extending back to 2001.
The latest Bank of England argument for delaying raising interest rates is that the pay pick-up is being accompanied by faster productivity expansion, so unit labour cost growth remains too low. This may not be true for much longer but, in any case, stronger productivity growth is a double-edged sword for policy, since it also suggests faster trend GDP expansion and a higher “equilibrium” level of rates.
The current earnings pick-up is consistent with the historical relationship with the job openings rate. As noted in a post in September 2014, “the openings rate bottomed in 2009 but embarked on a sustained rise only in the second quarter of 2012. Based on the average nine-quarter lag following the three increases over 1970-90, this suggests an upswing in earnings growth starting in the third quarter of 2014.” Regular earnings growth has risen steadily from a low of 0.7% in the second quarter of 2014 – see chart**.
The increase in pay growth is more impressive against a backdrop of falling / low consumer price inflation, which would be expected to subdue wage demands.
The job openings rate rose further in the fourth and first quarters, surpassing its 2008 high, though has since fallen slightly. If the first quarter peak is confirmed, the minimum six-quarter lead over 1970-90 would suggest a continued uptrend in earnings growth through the third quarter of 2016, at least.
*Vacancies as a percentage of employee jobs plus vacancies.
**Quarterly data except for the last data points, which refer to July for earnings and the three months to August for the openings rate.

Chinese money numbers better despite f/x intervention
Chinese headline money numbers for August were moderately encouraging, suggesting that policy easing is gaining traction. Annual growth of the broader M2 measure was unchanged from July at 13.3%, the fastest since July 2014. Narrow money M1 growth, meanwhile, jumped from 6.6% to 9.3% – see first chart.
The August numbers contradict claims that heavy currency intervention would result in a contraction of domestic liquidity. Foreign exchange reserves fell by $93.9 billion in August, equivalent to 0.4% of the stock of M2 and 1.6% of M1. The impact of balance of payments flows on the money supply, however, is usually swamped by other influences – in this case, monetary and fiscal policy loosening.
The preferred money measure here is “true M1”, which adds household demand deposits to the official M1 measure*. An August figure for household demand deposits is not yet available; unless they fall sharply, however, annual true M1 expansion will rise further from July’s 6.4%.
The six-month change in real (i.e. CPI-adjusted) true M1 turned negative at end-2014, signalling economic weakness during the first half of 2015. It recovered, however, through July – second chart. Industrial output regained momentum in the early summer, although the August number due shortly may show a relapse, judging from survey evidence.
Broad credit trends remain soft: the estimated stock of “total social financing” rose by an annual 11.7% in August, down from 14.5% a year earlier**. Growth, however, has stabilised recently, consistent with a trough in economic momentum.
*The exclusion of household demand deposits from the official measure may reflect their historical unimportance. Official M1 = cash in circulation plus demand deposits of corporations and government organisations.
**Stock estimated by cumulating historical flows.


