Entries from October 1, 2018 - October 31, 2018
Global monetary update: no recession signal
Global narrow money trends continue to signal a weak economic outlook but have not deteriorated further since early 2018 – a recession warning, in other words, has yet to be issued.
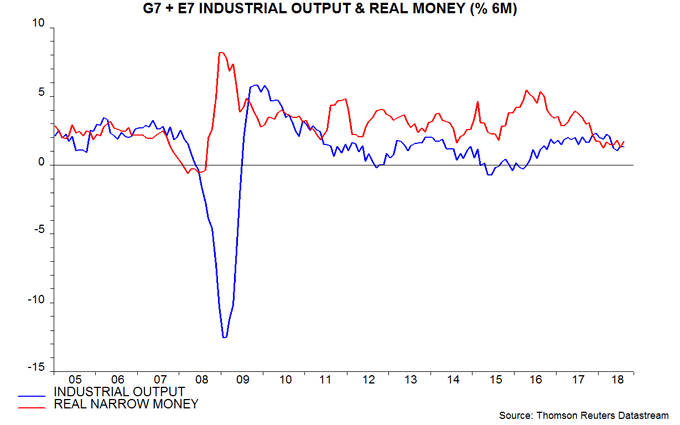
Six-month growth of global (i.e. G7 plus E7) real narrow money moderated in September but, in broad brush terms, has moved sideways since reaching a low in February, remaining below its range over 2009-17. Allowing for an average nine-month lead, the suggestion is that six-month industrial output momentum will bottom out in late 2018 and stabilise at a weak level in early 2019 – see first chart.

The expected economic slowdown is on track – G7 plus E7 six-month industrial output growth is estimated to have declined to a 26-month low in September, based on data accounting for two-thirds of the aggregate.
Narrow money trends have stabilised across the major economies: the six-month change in real narrow money is above its minimum over the last year in all the G7 plus E7 economies except Mexico and Korea. Real narrow money growth is relatively firm in Japan and Euroland and weak in the US (and China), casting doubt on the sustainability of recent US economic / equity market outperformance – second chart.

While the stabilisation of G7 plus E7 real narrow money growth is reassuring, trends have deteriorated further in smaller Far East economies suffering a triple squeeze from US rate hikes, China’s slowdown and tariff wars – third and fourth charts. These economies are too small to have a significant direct impact on global activity but associated financial stresses could contribute to an extension of the current “risk-off” move in markets, with negative feedback to monetary trends / economic prospects in the major economies.

 The two "monetarist" rules followed here for switching between global equities and US dollar cash recommended cash at end-September. The first rule, which prefers equities if G7 plus E7 six-month real narrow money growth is above industrial output growth, will move back into equities at end-October, since a positive gap was restored in August and appears to have been maintained in September – first chart.
As an aside, G7 plus E7 annual real narrow money growth remained below industrial output growth in August and, probably, September. A switching rule using annual growth rates would also have outperformed buy-and-hold significantly historically but by less than the rule based on six-month changes.
The second rule prefers equities if G7-only annual real narrow money growth is above 3.0%, its pre-GFC long-run average. Growth recovered in September but did not exceed this threshold, so this rule will remain in cash during November – fifth chart.

Profits taking strain of rising wage growth
Recent inflation news is consistent with the view here that rising wage cost growth is having a greater impact on profit margins than core price trends.
G7 headline and core (i.e. ex. food / energy and large tax changes) consumer price inflation eased for a second month in September. The core rate remains near the top of its post-crisis range but the recent July peak only matched a 2012 high, when labour markets and wage pressures were much weaker – see first chart.
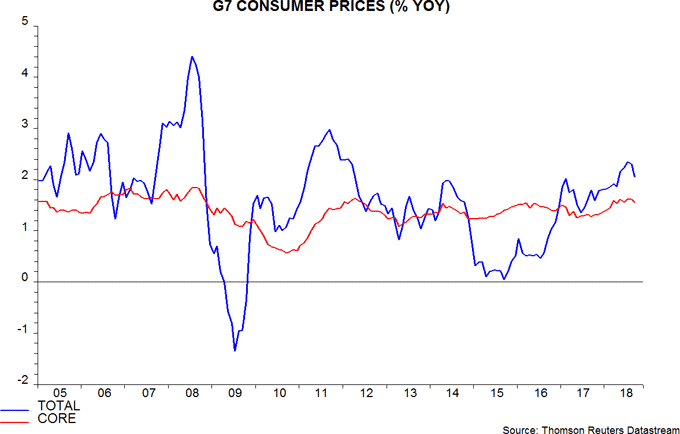
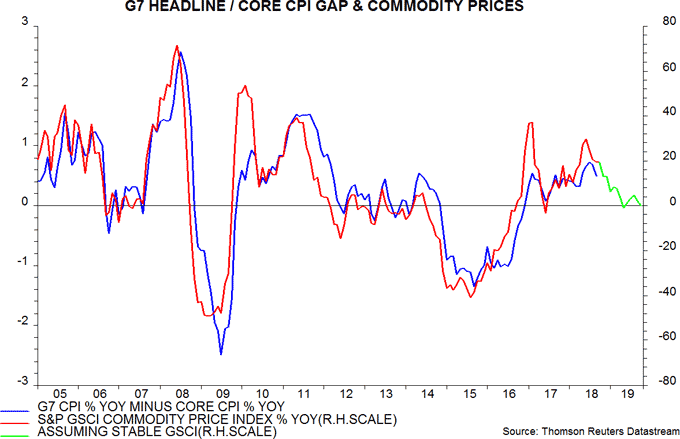
The headline / core gap probably peaked in July and is likely to fall further into early 2019, assuming that commodity prices remain at their current level – second chart.
The judgement here has been that firms would struggle to push through price increases against a backdrop of restrictive monetary conditions and slowing economic momentum.
The third chart compares annual growth rates of nominal GDP and narrow money for the G7 plus E7 grouping. Nominal GDP expansion probably peaked in the second quarter of 2018, the latest data point, with money trends signalling a sustained slowdown. Assuming stable or more likely rising wage growth, lower expansion of aggregate nominal income implies a slowdown or outright weakness in profits and / or employment. Profits should take the strain first, leading to subsequent employment cut-backs.

Euroland slowdown on track but money trends stable
Euroland narrow money trends signalled the current economic slowdown and now suggest that momentum will stabilise at a weak level in early 2019.
Six-month growth of real narrow money, as measured by non-financial M1 deflated by consumer prices, peaked in June 2017 and fell sharply through April 2018, reaching a five-year low. Allowing for a typical nine-month lead, this suggested that two-quarter GDP growth would top out in early 2018 and decline through year-end.
The slowdown, in the event, started slightly earlier, possibly reflecting euro strength during 2017. Two-quarter GDP expansion fell from 1.3% in the fourth quarter of 2017 to 1.1% in the first quarter of 2018 and 0.8% in the second quarter – see first chart.

Purchasing managers’ surveys signal a further loss of momentum since mid-year. The October flash reading of the composite output index is consistent, according to the survey compiler, with GDP expansion of only 0.3% per quarter.
Money trends, however, have stabilised since early 2018, with six-month real narrow money growth slightly higher in September than at end-2017. Real broad money – non-financial M3 – expansion has also edged up.
This may prove to be a pause before further deterioration but the implication is that GDP momentum will stabilise at a weak level in early 2019, in which case purchasing managers’ indices may find a bottom soon, although a recovery is unlikely.
The expectation here remains for GDP to rise by 0.25-0.35% per quarter, below the September ECB staff central forecast of quarterly growth of 0.4% in the second half of 2018, rising to 0.5% during 2019 – such a reacceleration now seems wildly unrealistic.
The Italian fiscal crisis and associated rise in the sovereign yield spread have yet to be reflected in any relative weakness of Italian money trends. Six-month growth of real non-financial M1 deposits was similar across the big four economies in September – second chart.

Chinese money trends stabilising, outlook still weak
Chinese money and credit trends appear to be starting to respond to policy easing but a further recovery is needed to warrant shifting away from a negative view of economic prospects.
GDP and other activity data released last week confirm that the economy continued to lose momentum during the third quarter. Six-month growth of narrow money*, however, rebounded last month, reaching its highest level since February – see first chart.
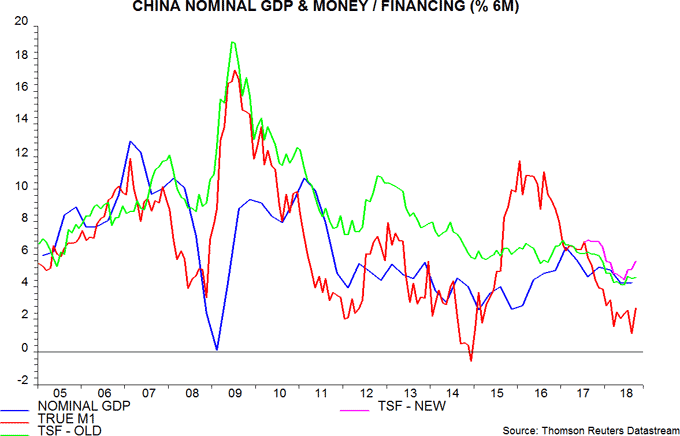
Total social financing (TSF) also accelerated, reflecting heavy issuance of local government special bonds, used to finance investment – such bonds were added to the TSF definition this month, with data backdated to January 2017. TSF growth on the former definition remained soft in September, probably partly reflecting local government issuance “crowding out” other financing – first chart.
The apparent bottoming out of money / credit growth suggests a future stabilisation of economic momentum but there is no signal yet of a meaningful rebound. Even if money trends continue to improve, economic growth is unlikely to revive before the second quarter of 2019 at the earliest.
Experience in 2015-16 is cautionary: six-month growth of narrow money was at a similar level in April 2015 and subsequently surged into double-digits (not annualised) but a significant pick-up in two-quarter nominal GDP expansion was delayed until the second quarter of 2016 – first chart.
Increased local government issuance / spending has contributed to a recovery in public sector fixed asset investment, the annual change of which turned positive in September – second chart. Further strength, however, could be offset by a slowdown in housing investment: housing floor space sold was down last month from a year ago, while starts lost momentum – third chart.


Recent and prospective increases in US import tariffs are an additional headwind, while the extent of a rebound in money growth remains unclear, with the authorities still reluctant to sanction full reopening of the credit taps. Such action, moreover, could result in a further increase in capital outflows, dampening the monetary impact and adding to downward pressure on the currency. The forward discount on the offshore yuan suggests that outflows have remained elevated so far in October – fourth chart.

An optimistic view is that significant income tax cuts implemented this month and further reliefs announced over the weekend to take effect in January 2019 will boost consumer spending growth; an acceleration of household demand deposits from October would lend support to this scenario.
Other leading indicators suggest near-term further economic weakness. A composite leading indicator proposed in a previous post as an alternative to the OECD’s measure continued to fall in September, signalling below-trend economic expansion – fifth chart.

*True M1 = official M1 plus household demand deposits. Official M1 = currency in circulation plus corporate demand deposits.
A "monetarist" perspective on current equity markets
“Goldilocks” is over. The economic backdrop for markets has been unusually favourable in recent years, with growth mostly solid but not strong enough to produce capacity strains, allowing monetary conditions to remain loose. Now, growth has gone cold but hot labour markets are pushing up wage costs, squeezing profits and causing central banks to turn more hawkish.
Previous quarterly commentaries suggested that the global economy would lose momentum progressively during 2018. This forecast is on track: six-month growth of industrial output in the G7 economies and seven large emerging economies* peaked in December 2017 and fell sharply over April-June 2018, with no significant recovery in July-August – see first chart. Business surveys suggest a near-term further slowdown: the global manufacturing purchasing managers’ index (PMI) fell for a fifth consecutive month in September, reaching a 22-month low.
The key forecasting indicator followed here – six-month growth of G7 plus E7 real (i.e. inflation-adjusted) narrow money** – bottomed in February 2018 and has moved sideways through August. Allowing for a typical nine-month lead, the suggestion is that industrial output growth will reach a low around November, stabilising at a weak level into early 2019. If correct, the manufacturing PMI may bottom out soon while remaining soft by recent historical standards.
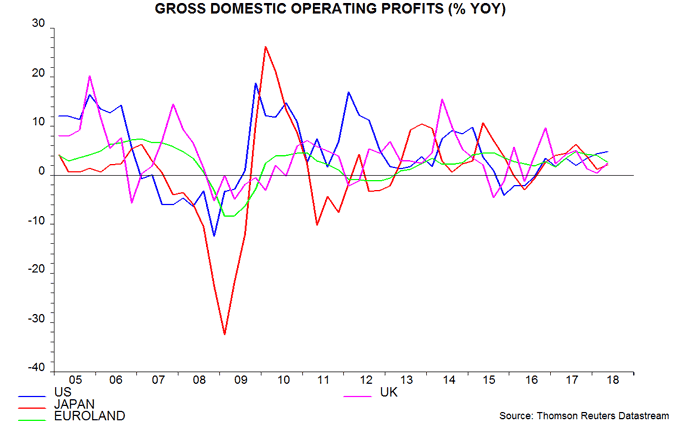
The suggested scenario of below-trend but stabilising economic growth would imply some easing of labour market pressures but would be unlikely to result in sufficient slack to reverse wage acceleration – unemployment rates are below estimated non-inflationary levels in most major economies. Recent stronger wage growth reflects worker demands for compensation for higher inflation as well as labour shortages. Faster growth of wage bills has contributed to a slowdown in profits in Japan, Euroland and the UK, a trend that may extend to the US during the second half – second chart.
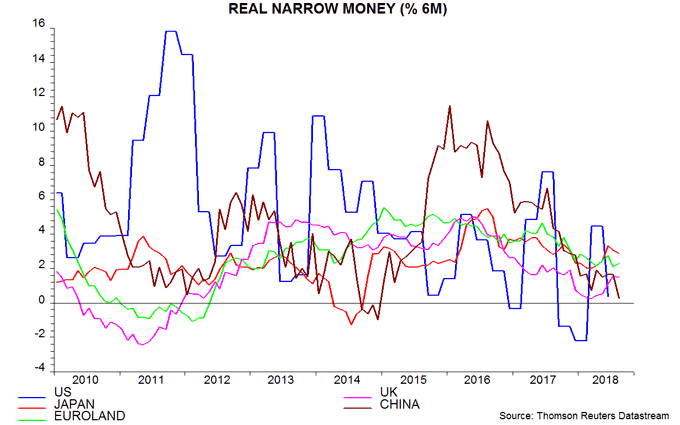
There have been three notable monetary developments since our last commentary. First, growth in our preferred US money measure, real non-financial M1***, fell sharply in the second quarter, signalling a likely loss of economic momentum in late 2018 / early 2019 – third chart. Business money holdings, surprisingly, have contracted despite tax cuts and repatriation of foreign retained earnings, with corporations choosing to step up equity purchases and lower borrowing rather than boost their liquid reserves.
Secondly, Chinese money trends continued to weaken through August despite a recent shift towards policy easing. This could reflect a normal response lag; alternatively, easing to date may have been insufficient, with the authorities maintaining their clampdown on shadow credit. Other leading indicators, meanwhile, are now confirming the negative message from money trends, suggesting heightened downside economic risk.
Thirdly, real money growth has stabilised in Euroland and recovered modestly in the UK, therefore improving compared with US / Chinese trends. Our inclination, however, towards greater optimism about European economic / equity market prospects is tempered by coming challenges – the withdrawal of QE support for weaker sovereign bond markets and a brewing Italy / EU fiscal clash in the case of Euroland, and possible further Brexit turmoil in the UK. The UK monetary recovery, moreover, could be aborted by the August rate hike.
Global economic prospects for later in 2019 will depend on monetary developments over the remainder of 2018. The forecasting approach here does not attempt to predict monetary trends but further weakness seems more likely than renewed strength. Fed policy tightening is being transmitted globally via the strong US dollar: central banks in 12 out of 32 developed and emerging markets raised official rates during the third quarter, while none cut. Recent oil price gains, meanwhile, could result in a larger inflation drag on real money trends.
Chinese money growth should be supported by policy easing but a 2015-style surge is unlikely, given official reluctance to reopen the credit floodgates. Reserve injections, moreover, could boost capital outflows, increasing downward pressure on the currency and limiting the authorities’ room for manoeuvre. China was rescued from this dilemma in 2016 by the Yellen Fed putting its rate-hike campaign on hold for a full year, relieving upward pressure on the dollar; the Powell Fed, judging from recent communications, is unlikely to be so accommodating.
The current monetary backdrop, in our view, warrants a cautious stance towards equity markets. Previous commentaries discussed two rules for switching between equities and cash based on monetary indicators. The first rule moves into cash if G7 plus E7 six-month real narrow money growth crosses beneath industrial output growth; the second does so if G7-only annual real narrow money growth falls below its long-run average of 3%. Both rules would have outperformed buy-and-hold significantly and both were in cash at end-September.
The first rule is likely to switch back into equities at end-October, based on available August monetary and output data, with the second rule remaining in cash. Historically, average equity returns have been below the long-term mean when the rules have given different signals, and significantly negative when they have both favoured cash.
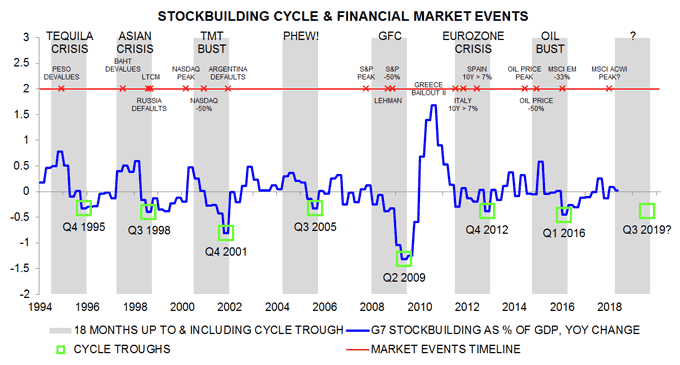
A cautious view of economic and market prospects is also suggested by cycle analysis, which we use to provide longer-term context for monetary signals. There are three key economic cycles: the 3-5 year stockbuilding cycle, the 7-11 year business investment cycle and the 15-25 year housing cycle. Shorter cycles “nest” within longer ones, in the sense that troughs tend to coincide. All three cycles hit bottom in 2009, explaining the severity of the 2008-09 recession.
Downswings in the stockbuilding cycle in 2011-12 and 2015-16 were associated with extended “soft patches” in the post-crisis economic upswing. Based on its average historical length of about 3.5 years, another stockbuilding cycle trough could occur in 2019, while the business investment cycle is scheduled to bottom by 2020 at the latest. The cycle analysis, therefore, suggests preparing for further economic weakness in 2019-20.
The stockbuilding cycle appears to be an important influence on financial market trends. Risk assets tend to weaken in the 18 months leading up to a cycle trough and rebound strongly in the first 18 months of the upswing. The fourth chart shows our suggested dating of cycle troughs and the implied 18-month “risk-off” periods for markets (shaded). Six of the last seven such periods were associated with a crisis and / or major bear market in one or more assets.
Based on our judgement that the last trough occurred in the first quarter of 2016, and assuming that the current cycle is of average length, the next low could occur in the third quarter of 2019. This would imply that another 18-month negative period for markets started in early 2018.
The table compares the performance of different assets since end-February 2018 with averages calculated over the previous seven 18-month negative periods. The pattern of returns is consistent with the assumption that markets entered a negative phase in early 2018, with overall equity market performance lacklustre, US stocks outperforming, cyclical sectors and emerging markets underperforming, the US dollar strengthening and a basket of commodity prices weakening.

If the current cycle returns were to conform to the historical averages, and assuming that our dating of the cycle is correct, equity markets would weaken by the third quarter of 2019, with cyclical sectors underperforming further. US and emerging market stocks, however, would stop outperforming / underperforming, the US dollar would be little changed, while the recent rise in US Treasury yields would reverse and corporate credit spreads would increase significantly.
*Brazil, Russia, India, China, Korea, Mexico and Taiwan.
**Narrow money = currency in circulation plus demand deposits and close substitutes. Broad money = narrow money plus time deposits, notice accounts, repos and bank securities. Precise definitions vary by country. Narrow money has been more reliable than broad money for forecasting purposes historically and is consequently emphasised in the analysis here.
***Non-financial = held by households and non-financial businesses.
Why have Treasury yields risen?
The long-standing forecast here has been for global economic momentum – as measured by the six-month rate of change of industrial output in the G7 economies and seven large emerging economies – to fall into late 2018 and remain weak in early 2019. Incoming news is consistent with this forecast. The global PMI manufacturing new orders index, for example, was reported last week to have declined further in September, with export orders now in contraction territory – see first chart.

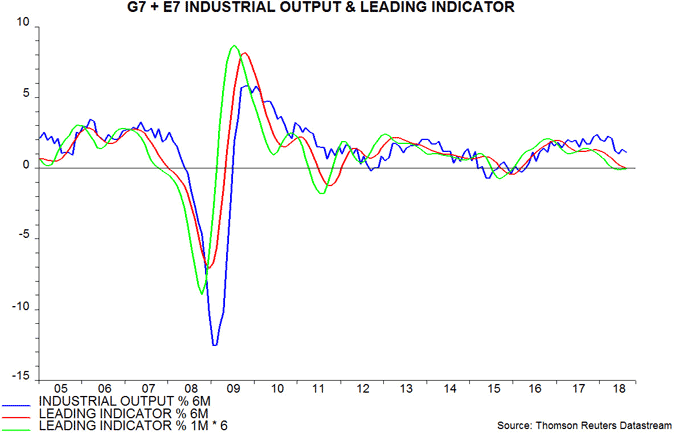
The OECD yesterday released August data for its country composite leading indicators, allowing an update of the global (G7 plus E7) leading indicator tracked here. The six-month rate of change of this measure fell again, consistent with a further economic slowdown into late 2018 – the indicator typically leads by four to five months. The one-month change, however, has stabilised recently, suggesting that downward pressure is starting to ease, although confirmation is required – second chart.
Why, then, did US Treasury yields break higher last week? Yields typically fall during global economic slowdowns. Are Treasuries looking through current weakness and sniffing another pick-up in growth from early 2019, with associated inflationary risks?
Such a pick-up, on the view here, is unlikely without a prior rise in global real narrow money expansion, which remained soft through August. With monetary policies tightening or on hold in most economies, it is not obvious why money trends should strengthen.
The exception, of course, is China, where recent easing steps – including an addition large cut in bank reserve requirements announced over the weekend – raise the possibility of a monetary rebound. September money data due shortly will be important but the suspicion here is that the authorities are “behind the curve” – see previous post. Reserve injections, moreover, may serve mainly to boost capital outflows.
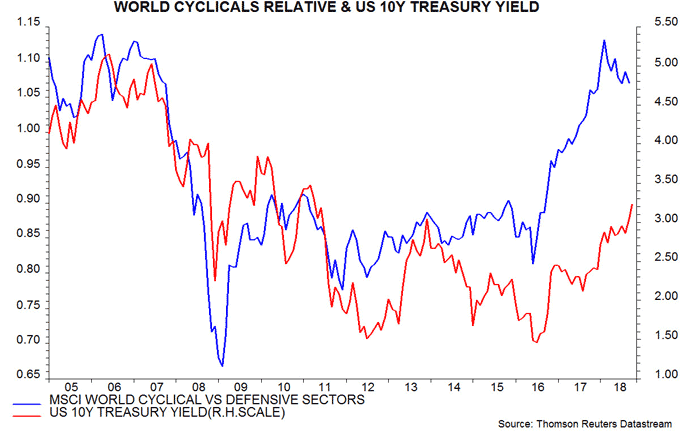
Equity market behaviour appears inconsistent with the notion that Treasury yields are being pushed higher by rising economic optimism. Yield increases in 2012-2013 and 2016-early 2018 were accompanied by rising equity markets and outperformance of cyclical sectors. Now, equities are struggling and cyclical sectors fell further relative to defensive sectors last week – third chart.
The yield rise may reflect the weight of official Treasury supply rather than reduced demand due to stronger economic / inflation expectations. The outstanding stock of marketable Treasury securities rose by $1,078 billion in the 12 months to September, with the portion held outside the Fed up by $1,230 billion – fourth chart. The former increase is significantly higher than the federal deficit – $890 billion in the 12 months to August, the latest available month – because the Treasury issued additional debt to fund an increase in its cash balance at the Fed.
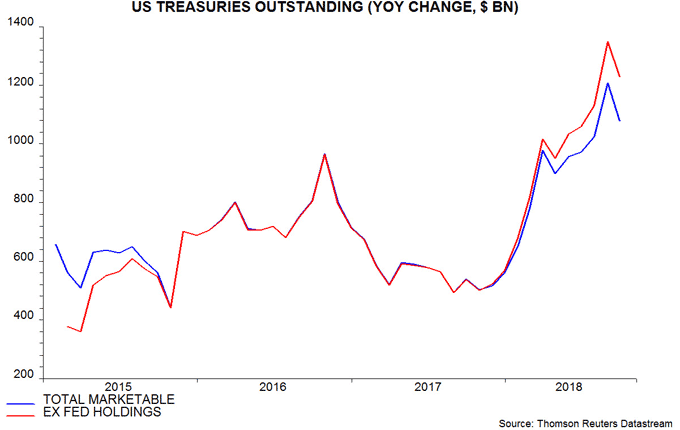
Supply to non-official holders is also being boosted by currency intervention by foreign monetary authorities attempting to contain dollar strength. Chinese official reserves fell by $23 billion last month, with most of this decline likely to reflect intervention rather than valuation changes.
Rises in Treasury yields accompanied by underperformance of cyclical equity market sectors also occurred briefly in 2006, 2007 and 2008 – third chart. On the first occasion, yields fell back and cyclicals rallied; in the latter two cases, both yields and the cyclicals / defensives ratio declined.
Until global money trends suggest an end to the current slowdown / weak growth phase, the rise in Treasury yields will be interpreted here as an additional reason for caution about equity market prospects.

