Entries from October 1, 2016 - October 31, 2016
Chinese activity data mostly positive
There were two pieces of good news and one disappointment in today’s Chinese activity data.
Annual growth of nominal GDP rose further to 7.8% in the third quarter, the fastest for two years and up from a low of 6.0% in the third quarter of 2015. Growth of real GDP was stable at 6.7%, while the annual increase in the GDP deflator firmed from 0.6% to 1.0%. The nominal pick-up was predicted by a rise in money growth from spring 2015, with the latest monetary data suggesting further acceleration – see first chart and yesterday’s post.
The second positive was a further recovery in private fixed asset investment, which rose by an annual 4.5% in September, having fallen 1.2% in June. The investment revival follows a strong rebound in profits and robust growth in money holdings of non-financial enterprises (NFEs) – second chart.
The disappointment was that annual industrial output growth slipped from 6.3% in August to 6.1% in September. Industrial activity has been held back factory closures in “old economy” activities – coal output, for example, fell by 12.3% in the year to September. The rebalancing of the economy away from heavy industry is evidenced by electricity consumption data: annual growth in the tertiary (services) sector was 14.9% in September versus 1.5% for secondary industry (i.e. manufacturing).
Pessimists argue that GDP growth has been boosted by temporary stimulus measures (e.g. auto sales incentives due to expire at end-2016) and an overheated housing market, which the authorities are now taking steps to cool. The view here is that a renewed economic slowdown is unlikely given monetary trends, an emerging investment recovery and the current leadership’s desire to maintain solid growth ahead of the autumn 2017 party congress, when key positions will be allocated.
Chinese money trends signalling ongoing reflation
Chinese monetary growth remained strong in September, supporting expectations that the economy will continue to reflate despite administrative attempts to cool an overheating housing market.
The preferred broad money aggregate here is M2 excluding financial deposits – the latter have fluctuated widely in recent years but have little connection to money spending. Annual growth of this measure was stable at 12.8% in September, more than double a low of 6.3% in June 2015 and the fastest since 2013 – see chart.
Total M2 growth was lower at 11.5%, reflecting a fall in financial deposits over the past 12 months. M2 ex financial deposits has been a superior economic gauge in recent years, signalling the 2014-15 downturn as well as this year’s recovery. M2 was misleadingly strong in 2014-15 as financial deposits surged.
Annual M1 growth, meanwhile, remained buoyant at 24.7% in September, down from 25.3% in August. As previously discussed, the Chinese M1 definition omits household demand deposits, which are added back here to create “true” M1. Such deposits grew by an annual 16.0% in September, while demand deposits of non-financial enterprises and government organisations rose 28.3%. Annual true M1 growth was 21.7% in September versus 22.1% in August.

Global acceleration watch: corporate profits
The forecast here that global growth will pick up into 2017 rests importantly on an assumed recovery in business spending. Firms are expected to turn more expansionary partly in response to a recent revival in profits.
The first chart shows annual rates of change of S&P 500 reported earnings*, incorporating a bottom-up Capital IQ consensus estimate for the third quarter, and Chinese industrial profits, as reported by the National Bureau of Statistics. Chinese profits resumed growth in early 2016 and are rising at their fastest pace since 2013. US earnings seem to be following.
The second chart shows the IBES consensus estimate for MSCI World 12-month-forward earnings per share (EPS) in US dollars, along with the “revisions ratio” – the number of analyst upgrades in the latest five weeks minus downgrades, expressed as a proportion of the total number of estimates (and seasonally adjusted). The forward EPS estimate has been trending higher since early 2016, while the revisions ratio is the strongest since 2014.
*Total index earnings not earnings per share.
UK 2017 inflation rise: blip or ratchet?
UK consumer price inflation is expected here to rise above 3% during 2017, exceeding Monetary Policy Committee (MPC) and consensus forecasts. The MPC is likely to try to avoid tightening policy in response, arguing that it intends to “look through” the increase, an approach it claims was successful in 2008 and 2011, when CPI inflation reached over 5% before falling back. Monetary growth, however, is much stronger than in those years, suggesting that the coming inflation rise will represent a permanent upward shift rather than a “temporary blip”. In reality, key MPC officials may now be covertly in favour of aiming for a sustained overshoot of the inflation target, a policy recently embraced explicitly by the Japanese monetary authorities.
A post in May presented long-term evidence showing that all major swings in “core” inflation (i.e. excluding food / energy costs, tax effects etc) since World War 2 were preceded by a significant change in monetary growth, typically by between two and three years. Annual broad money growth, as measured by non-financial M4, has been trending higher since 2011, reaching 6.6% in August, the fastest since 2008. Monetary forces, therefore, will be pushing up on inflation in 2017 and 2018 – see first chart*.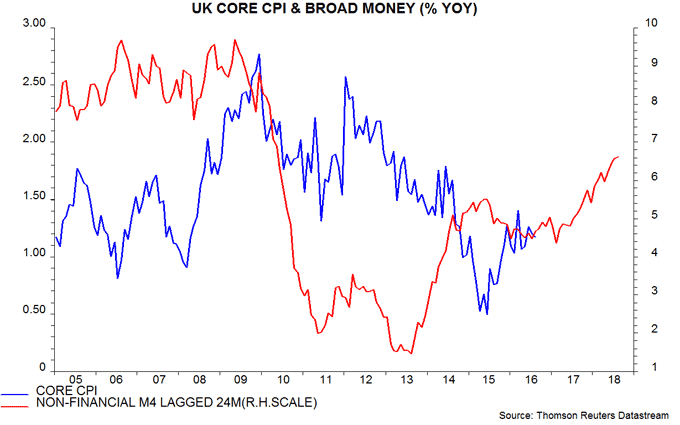
The rise in core inflation to date has been delayed and muted by the lagged impact of exchange rate strength over 2013-15. The currency effect, of course, is about to become a powerful tailwind. Manufactured import prices rose by 7.3% in the year to August and annual growth is likely to reach 10-15% by early 2017, barring a significant recovery in sterling. Import price changes appear to have their maximum impact on core CPI inflation after about a year, suggesting strong upward pressure from late 2016 – second chart.
Core CPI inflation, therefore, is expected here to rise from 1.2% in August to about 2.5% by late 2017. Headline CPI inflation, meanwhile, is likely to be pushed significantly above the core rate by rising energy and food prices due to sterling weakness and stronger global commodity costs. Based on current sterling commodity prices, the headline-core inflation gap may increase to over 1 percentage point by mid-2017 – third chart. Combined with a strengthening core trend, this would probably be sufficient to lift the headline rate above 3%.
The CPI inflation surges in 2008 and 2011 proved temporary partly because they occurred against a backdrop of weak and falling monetary growth – the annual increase in non-financial M4 bottomed at 2.0% in 2009 and 1.5% in 2011. Recent strong growth has yet to peak, suggesting that core CPI inflation will remain under upward pressure until late 2018, at least. The coming inflation overshoot, therefore, is likely to be sustained, unless global commodity prices turn down afresh or sterling stages an improbable large recovery.
*Core CPI = CPI excluding energy, food, alcohol, tobacco and education, and adjusted for VAT changes.
Global acceleration watch: OECD leading indicators
The assessment here is that the global economy has been gaining momentum since mid-year and growth over the next six to 12 months will be significantly stronger than expected by policy-makers and the consensus. This series of short posts will highlight incoming evidence that supports, or refutes, this view.
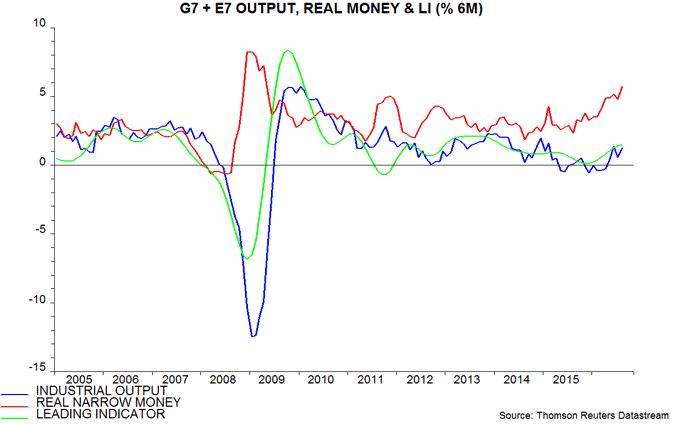
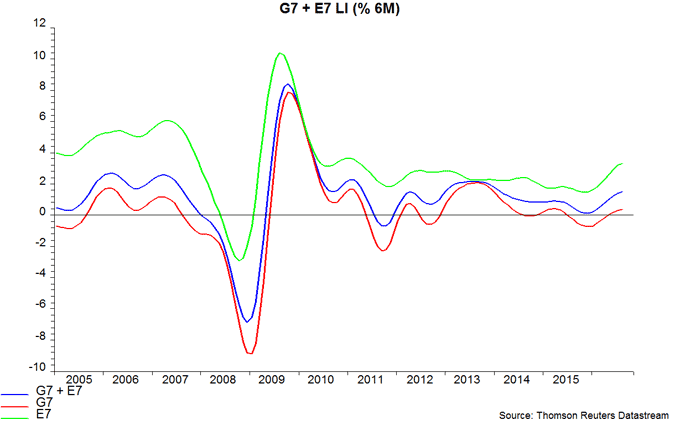
The OECD yesterday released August data for its country leading indicators, allowing calculation of the composite G7 plus emerging E7 leading indicator tracked here. Six-month growth of the latter rose further – see first chart. Both G7 and E7 components contributed to the increase – second chart.
The rise in leading indicator growth from a low in December 2015 follows a pick-up in G7 plus E7 six-month real narrow money expansion from a bottom in August 2015. The further increase in real money growth to a seven-year high in August 2016 suggests that the indicator will continue to gain momentum.
Sterling not overvalued before Brexit vote
Brexit-supporting economists argue that the referendum result hastened a fall in the pound that was inevitable and will ultimately prove beneficial. Such claims are dubious.
The Brexit supporters cite the large current account deficit – equivalent to 5.9% of GDP in the second quarter of 2016 – as evidence that the pound was significantly overvalued. The trade deficit in goods and services, however, was 2.6% of GDP in the second quarter, close to its average of 2.4% between 2000 and 2015. It has been trendless in recent years despite relatively strong UK domestic demand growth – see first chart.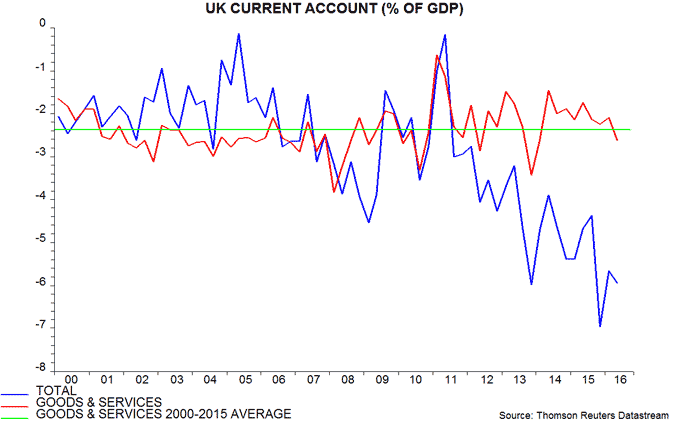
Business survey evidence refutes the claim that the pre-referendum level of the exchange rate was limiting export performance. The percentage of CBI industrial firms citing pricing as a constraint on exports stood at 49% in April, below a 2000-15 average of 54%. The long-term average (since 1972) of this series is 58% – second chart.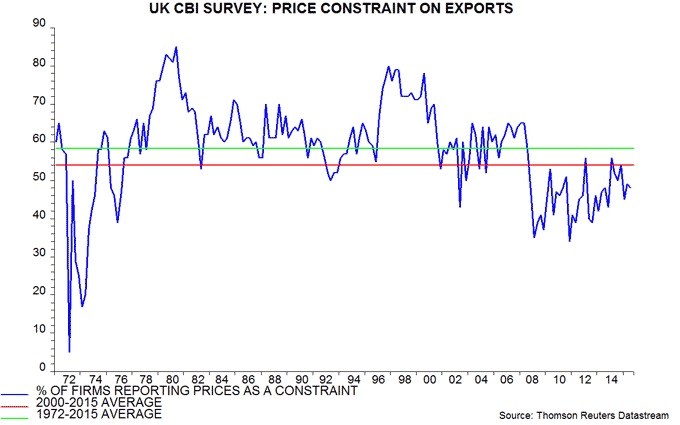
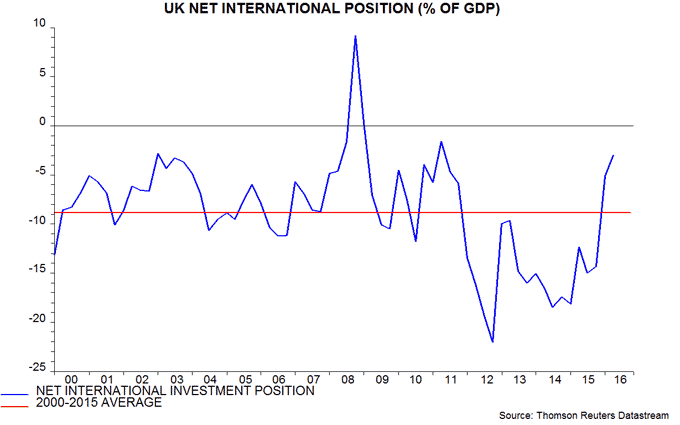
The rise in the current account shortfall has been driven by a move from surplus to deficit in the investment income balance. This move, however, has reflected a change in the form of the return received on foreign assets from income to capital gain. The cumulative capital gain on the net international investment position in recent years has exceeded not only the income deficit but also the overall current account shortfall. The net investment position (i.e. external assets minus liabilities) stood at -5.1% of GDP at the end of the first quarter (before the referendum) versus a 2000-15 average of -8.8% – third chart.
An alternative view is that the fall in the pound was not inevitable but has been the result of international investors revising down their assessment of the equilibrium value of the exchange rate in response to 1) the UK opting for inferior trading arrangements with its largest export market and 2) post-referendum monetary and fiscal loosening. The MPC bears significant responsibility – cutting rates and launching more QE when broad money is growing at a double-digit pace* is a recipe for a weak currency.
Monetary trends were signalling a rise in inflation in 2017 well before the Brexit vote. Sterling’s slide will accelerate the pick-up as import prices surge – fourth chart. CPI and RPI inflation are expected here to rise above 3% and 4% respectively during the course of next year. Will Brexiters comfortable with the pound’s decline also defend these increases as inevitable and necessary?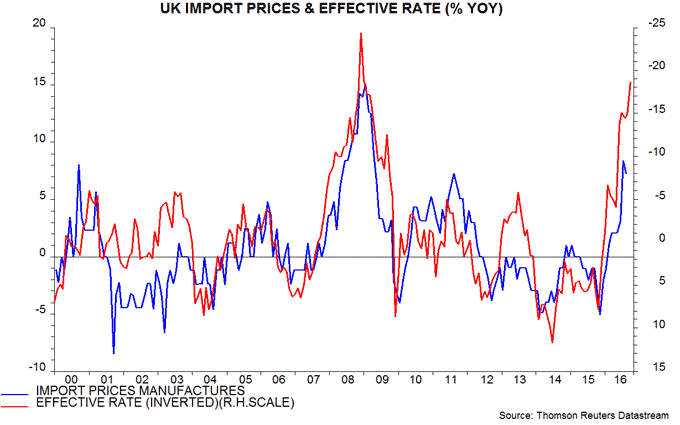
*M4ex rose at an annualised rate of 11.3% in the four months to August.

