Entries from October 1, 2014 - October 31, 2014
Global money trends flashing amber not red
Global six-month real narrow money growth – the key forecasting indicator monitored here – appears to have partially reversed a sharp August fall in September, based on data covering 60% of the aggregate. The recent behaviour of the indicator suggests that industrial output growth will rebound near-term before declining again from early 2015.
Real narrow money growth fell during the second half of 2013, correctly signalling an economic slowdown during the first half of 2014 – see chart. It revived in early 2014, however, resulting in a forecast here of a recovery in economic momentum from the summer, based on an average half-year lead from money to activity. Economic weakness, instead, has extended, with six-month industrial output growth falling to a 21-month low in August. This extension is consistent with normal variation in the money / activity lead time.
Real narrow money growth remained solid through July but dropped sharply in August. The preliminary data suggest that it remained well below the first-half average in September.
To summarise, real money trends do not support market fears that the global economy is sliding into another recession. Such a scenario would require that 1) the rise in real money growth in early 2014 was a false signal and will not be reflected in a near-term recovery in output growth and 2) the economy will enter a recession without a prior real money contraction – historically a rare occurrence.
As stated in a post last week, the expectation of a recovery in output growth will be maintained unless real money expansion or the longer leading indicator tracked here weaken further. The leading indicator was little changed in August while an energy-driven fall in inflation will support real money growth near term.
Why commodities may be signalling brighter economic prospects
The recent fall in commodity prices is widely viewed as evidence of a weak global economy. Relative commodity moves, however, may signal improving economic prospects.
The Standard & Poor’s GSCI commodity price index has fallen by 12% in US dollar terms so far in 2014*. Crude oil has led the decline, dropping 16%, but food prices have also weakened – the UN Food & Agriculture Organization index is down 7%, with dairy prices slumping 29%. The poor performance partly reflects a stronger dollar – the Federal Reserve’s broad trade-weighted index has risen 5%.
Lower energy and food costs may cut the annualised rate of global consumer price inflation by about 1% at an annualised rate over the next six months, providing a significant boost to real incomes and spending power.
Commodity price weakness has not been universal. In particular, the S&P GSCI base metals index – dominated by copper and aluminium – is little changed since end-2013.
This may be significant. A softer global economy should be reflected in a generalised decline in industrial commodities. The stability of base metals suggests that the fall in crude oil has been driven by an expansion of supply more than reduced demand. Such a favourable supply shock is positive for future economic growth.
The chart shows six-month changes in global industrial output and the ratio of base metal prices to the oil price, both measured by the S&P GSCI. An increase in the ratio is usually associated with solid or rising future output growth. The current signal is positive – economic pessimism is questionable unless metal prices fall or oil rebounds strongly.
*Quoted figures are the latest available on 10 October 2014.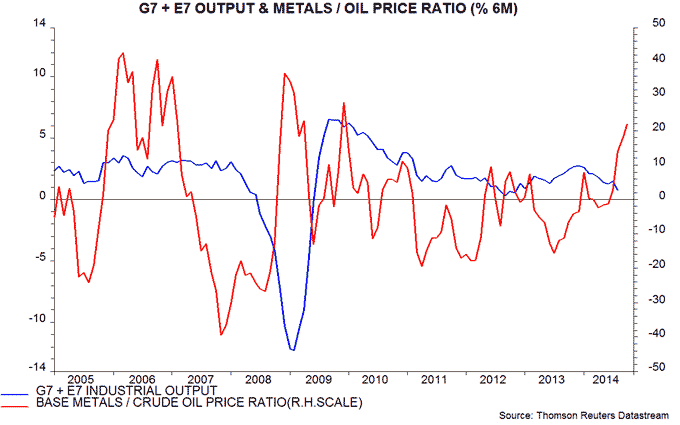
When will global growth revive?
Global six-month industrial output growth was expected here to recover from mid-year, following a rise in real narrow money expansion in early 2014 and an accompanying firming of leading indicators. It appears, instead, to have fallen to a new low in August, based on available country data – see first chart. Has the expected revival been postponed or cancelled?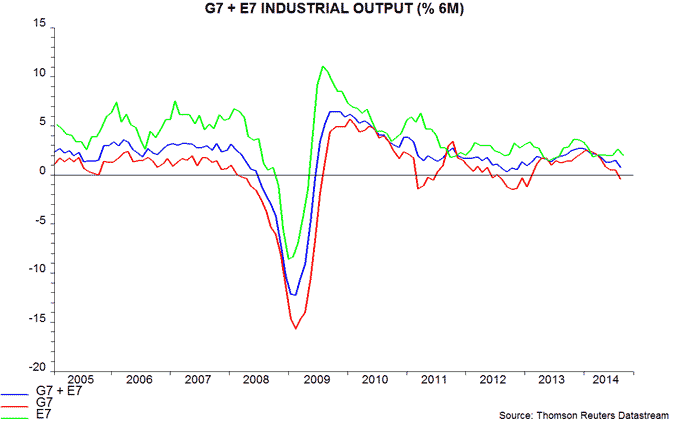
Note, first, that the further weakening into August is consistent with normal variation in the real money / activity relationship. Real money growth bottomed in November 2013 and leads turning points in output momentum by six months on average. The lead time in recent cycles, however, has extended as long as 11 months, suggesting that an output growth trough could occur as late as October 2014.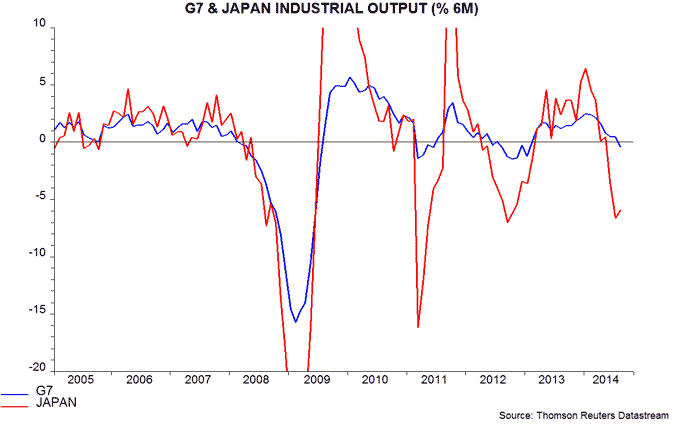
The extension of the global slowdown mainly reflects a further fall in G7 output growth – first chart. This, in turn, owes much to a continued production adjustment in Japan, where demand significantly undershot firms’ expectations following April’s sales tax hike – second chart. There is some similarity with the demand / output shock associated with the 2011 Tohoku earthquake, which exacerbated a "soft patch" in the global upswing.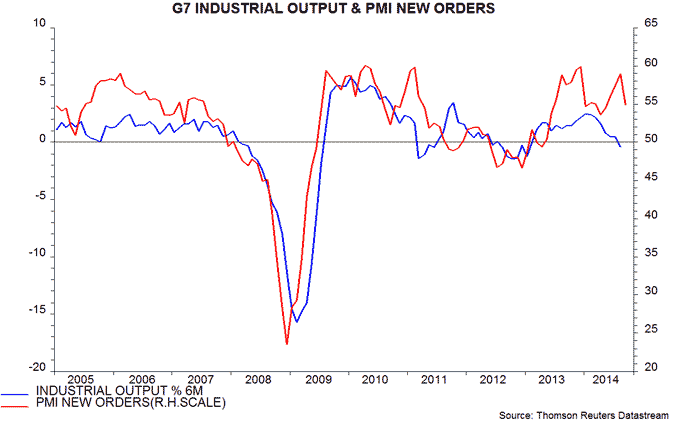
The Japan effect may help to explain the recent divergence of industrial output data and business surveys. G7 manufacturing purchasing managers’ surveys strengthened between April and August, consistent with the growth revival scenario, but reversed much of the gain in September – third chart. There was a similar breakdown in the output / surveys relationship in 2011: the PMIs were overoptimistic at the start of the year but then weakened significantly even as activity rebounded.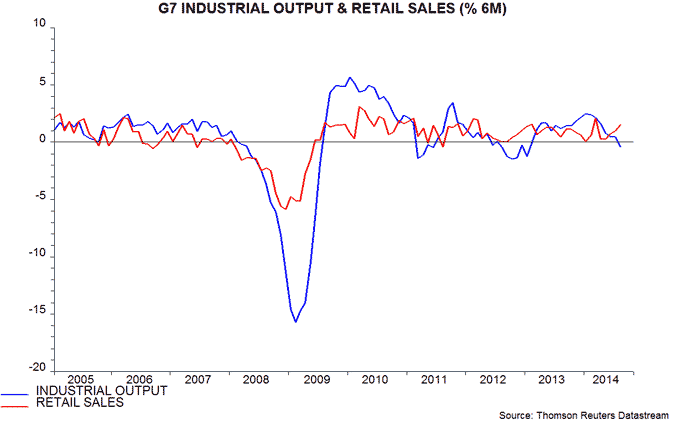
One development consistent with an imminent output recovery is a pick-up in retail sales momentum through August – fourth chart. The positive divergence with output suggests that the stocks cycle is moving into a more favourable phase. Rises in the sales / output ratio are usually followed by a significant increase in output growth – fifth chart. An energy-driven fall in consumer price inflation may support retail demand near term.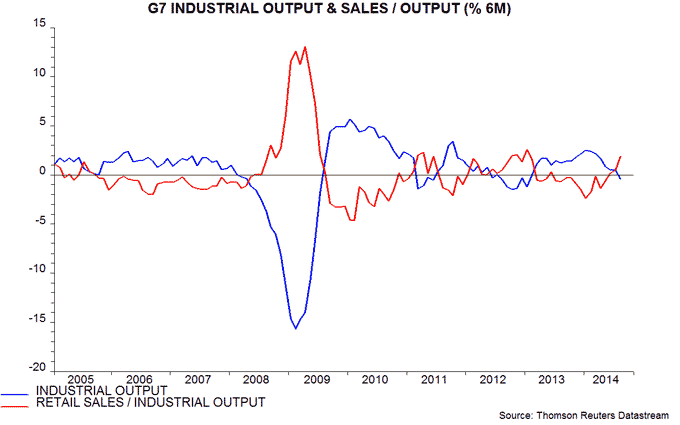
The positive retail sales / industrial output divergence extends to Japan – sixth chart (showing levels rather than growth rates).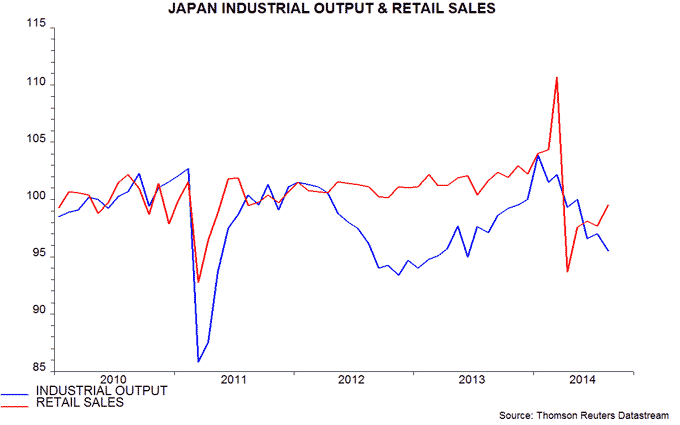
The favoured scenario of a near-term recovery in output growth will be maintained unless real money expansion or the longer leading indicator tracked here weaken notably. An August leading indicator reading will be available later this week. Global real narrow money growth fell in August but this mainly reflects a decline in the US, which appears to have reversed in September – see previous post.
ECB reaction: no surprises as "QE lite" proceeds
The ECB today provided more details about its asset-backed securities (ABS) and covered bonds purchase programmes but gave no encouragement to forecasts that it will soon begin buying government bonds on a large scale. This may reflect a judgement that its actions since June coupled with a weaker exchange rate have delivered sufficient stimulus for now. More likely, the Governing Council remains deeply split on “full” QE.
The most important new information today was President Draghi’s statement that the “potential universe” of the ABS and covered bonds programmes is up to €1 trillion. The QE programmes in the US, Japan and UK have resulted in the respective central banks owning 19-26% of the stock of central government securities. Similar ECB ownership of the ABS / covered bonds universe would imply buying of €200-250 billion in total – lower than many estimates and equivalent to only 2.1-2.6% of annual GDP.
The ECB could buy a higher proportion of the outstanding stock and the universe is likely to expand as the central bank bids up prices. The former possibility, however, may be limited by liquidity considerations while the latter will take time.
With the new targeted longer-term refinancing operations (TLTROs) likely, at best, to offset the expiry of the 2011 / 2012 three-year repos over the next six months, ECB balance sheet expansion is likely to prove slow and it remains doubtful that President Draghi’s aim of an eventual return of assets to the early 2012 level – implying a rise of at least €600 billion – can be achieved without further initiatives.

