
Entries from November 1, 2020 - November 30, 2020
G7 inflation rebound ahead
 Simon Ward
 Post a Comment
G7 headline and core CPI inflation are likely to pick up into Q2 2021. The “monetarist” view here is that increases will be sustained into 2022, reflecting the surge in G7 broad money in Q2 / Q3 2020.
Headline CPI inflation eased to 0.6% in October, above a May low of 0.2%; core inflation, i.e. ex. food and energy, returned to its low of 1.0% – see first chart. Core inflation is at its weakest level since 2011. These numbers are calculated by averaging national data using GDP weights.

Both headline and core rates have been temporarily depressed by covid-related tax relief and subsidies, including the temporary VAT cuts in Germany and the UK and the Go To Travel programme in Japan. The headline rate also reflects a steep year-on-year fall in energy prices. Core inflation ex. tax and subsidy effects is estimated here at 1.3% in October, close to a 1.4% average since 2012 – first chart.
The impact of energy and other commodity prices on headline inflation will shift from negative to significantly positive by Q2 2021, reflecting a base effect from the plunge in prices into April 2020. The gap between headline and core inflation could move from -0.4 percentage points (pp) in October to +1 pp or more, assuming that commodity prices are stable at their current level – second chart.

The tax / subsidy measures are scheduled to expire by Q2. If “true” core inflation is stable at 1.3%, headline inflation could rise to 2.3% or higher, representing a sharp increase from the current 0.6%.
Will core inflation also rise? The recent recovery in the adjusted measure mirrors a rebound in the global composite PMI output price index, which is above its average since 2009 (when the series starts) – third chart. The index fell slightly in October but November flash results suggest a rise to a new recovery high.

The consensus view that inflation will remain weak relies on “output gapology”. The “monetarist” forecast of a significant pick-up rests partly on strong demand growth rapidly eroding slack but also a direct effect of monetary excess on commodity prices and pricing power more generally. Manufacturing capacity use is already approaching normal while pent-up demand may result in bottlenecks in services as economies reopen, allowing firms to widen margins to offset covid-related losses.
How far could G7 inflation rise? A smaller increase in broad money growth in the late 2000s was associated with a pick-up in CPI inflation to a peak of over 4%. That rise, however, was rapidly reversed as broad money contracted in the aftermath of the GFC. A reasonable expectation is that headline CPI inflation will reach 4%+ again in 2021-22 and will remain elevated as central bank financing of fiscal deficits supports broad money growth above its 2010s average.
A "monetarist" forecast for UK inflation
This year’s surge in global broad money is expected here to result in a significant inflation pick-up in 2021-22. The timing, magnitude and sustainability of this rise, however, are uncertain, the latter depending importantly on the extent to which broad money trends normalise over coming quarters.
Are there early signs of a pick-up? The UK has often been a bellwether of rising global inflationary pressures, perhaps reflecting the historical weakness of its policy institutions. UK headline CPI inflation remains well below target but the underlying rate is significantly higher and rising.
The UK inflation debacles of the 1970s and late 1980s predated Bank of England independence. Recent signals from the Bank, however, have been less than reassuring: the new Governor has emphasised the Bank's role in ensuring low government financing costs, while the quarterly policy report was changed to remove “inflation” from the title, with recent editions containing no discussion of the monetary surge.
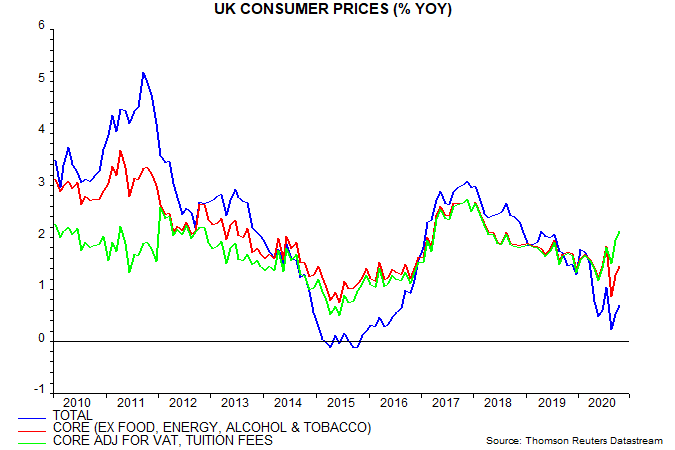
The headline CPI rate rose in October but, at 0.7%, remains far below the 2% target. The current low level, however, is entirely explained by weakness in energy and, to a lesser extent, food prices, along with the temporary cut in VAT in the hospitality sector.
The conventional core rate excluding food, energy, alcohol and tobacco was 1.5% in October. The underlying measure calculated here also excludes student tuition fees, which were a distorting factor in some recent years, while attempting to correct for VAT changes. The latter adjustment requires an estimate of the extent to which changes are passed on to consumers: a conservative assumption of 35% is used for the hospitality cut. On this basis, underlying inflation is estimated at 2.1% in October, representing a significant rise from a May low of 1.2% – see first chart.
Research on post-WW2 UK data conducted in 2016* found a convincing leading relationship between turning points in annual broad money growth and underlying inflation, with a variable lead time averaging 26 months. The rise in the underlying rate since May is consistent with a recovery in broad money growth, as measured by non-financial M4, from a low in November 2018 – second chart.
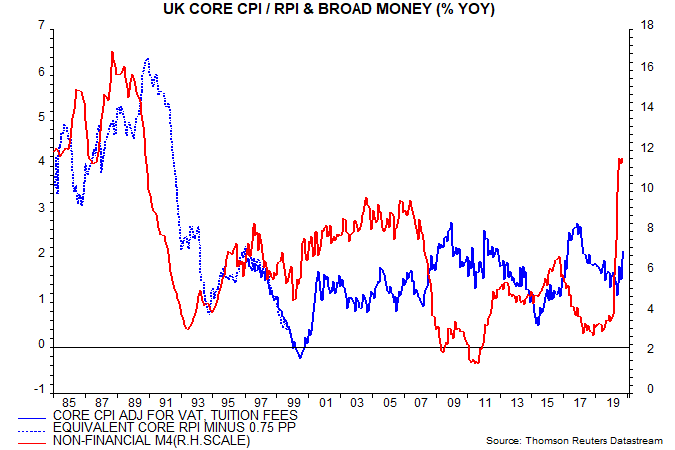
Money growth, however, remained modest through February 2020. The subsequent surge, coupled with covid-related cost pressures, may have advanced and magnified the expected inflation increase. Money growth may be peaking but underlying inflation is likely to trend higher until late 2021, at least, even allowing for a shorter than average lead time.
Exchange rate developments can temporarily disrupt the money-inflation relationship. A 24% rise in sterling’s effective rate in 1996-97, for example, advanced and magnified an inflation decline in the late 1990s, when the relationship appears to become coincident – second chart. Conversely, a 25% sterling drop in 2007-08 delayed an inflation fall signalled by a collapse in money growth into 2011. Recent exchange rate moves have been small, with the effective rate currently 2% lower than a year ago.
The third chart shows possible paths for headline and underlying CPI inflation consistent with the above analysis. The projections assume:
- 1) A rebound in energy prices in 2021 as the global economy grows strongly, resulting in a 10% rise in the Ofgem energy price cap and vehicle fuel costs returning to late 2019 levels.
- 2) A rise in CPI food inflation from 0.6% in October to 2.0% by end-2021, reflecting recent and expected further increases in food commodity prices and additional EU supply chain costs.
- 3) No further extension of the 5% VAT rate in hospitality beyond the planned 31 March end date, with 35% pass-through of the subsequent rise.
- 4) A 2.25% pa rate of increase in the underlying CPI measure tracked here, marginally higher than the estimated 2.1% annual rise in the year to October.

Headline CPI inflation averages 3.2% in Q4 2021 compared with a Bank of England central projection of 2.1%. The assumptions are arguably conservative, with possibilities of more pronounced commodity price strength as the global economy rebounds and a larger rise in underlying inflation following the monetary surge.
*Report available on request.
Global "excess" money less favourable
Recent economic and monetary data confirm that the monetary backdrop for markets has become temporarily less favourable.
Market prospects are related to the concept of “excess” money growth – the gap between the actual rate of growth of the money stock and the growth rate needed to support economic expansion. A positive gap is associated with an increase in demand for financial assets and upward pressure on their prices.
Excess money growth is unobservable. Two proxy measures are monitored here – the gap between real narrow money and industrial output growth, and the deviation of real money growth from a slow moving average.
Global versions of the two measures are shown in the first chart, which provides evidence of their usefulness for anticipating market environments.

Both measures surged after the Q1 slump in equity markets, suggesting an unusually favourable buying opportunity.
The final data points for the measures in the chart are for September. The second measure – the deviation of 12-month real narrow money growth from its moving average – will remain positive well into 2021. Recent data, however, confirm that the first measure – the gap between six-month growth rates of real money and industrial output – will have turned negative in October.
September industrial output data are now available across countries. Global (i.e. G7 plus E7) output surpassed the pre-covid peak in September, one month earlier than had been expected here – second chart. Six-month growth rose to 6.2% (not annualised) and is likely to have reached more than 20% in October, reflecting the dropping out of April’s 12.8% output plunge.

G7 plus E7 six-month real narrow money growth, meanwhile, is estimated to have moderated to 9.5% in October, based on monetary data for the US, Japan, China, Brazil and India, together accounting for 70% of the G7 plus E7 aggregate. So real money growth will have crossed beneath industrial output growth last month – third chart.

This real money growth shortfall is likely to prove temporary. Six-month industrial output growth will fall back sharply as base effects shift from positive to neutral. Recent monthly momentum suggests that real money growth will stabilise above likely output growth. The illustrative projections shown by the dotted lines in the chart imply restoration of a positive real money / output growth gap in January.
The current move into negative, nevertheless, warrants a more cautious view of immediate market prospects than in the spring and summer.
A relevant comparison may be with September 2009-June 2010 during the initial economic recovery from the GFC recession. G7 plus E7 six-month real narrow money growth was below (strong) industrial output growth during this period but 12-month real money growth remained above its moving average – see first chart. The global stockbuilding cycle, moreover, was in an upswing phase, as it is likely to be through late 2021, at least.
Global equities were little changed in July 2010 from September 2009 but there was significant volatility over the period. Cyclical sectors outperformed slightly, led by industrials and consumer discretionary. Financials lagged, partly reflecting a post-GFC regulatory clampdown – not a current feature. Emerging markets outperformed and commodity prices strengthened. Treasury yields initially moved higher but ended the period lower after equities corrected.
The current negative real money / output growth gap, as noted, may last at most three months versus the 10 months in 2009-10. The market effects could be smaller than in 2009-10, particularly in view of the earlier record positive gap. The suggestion in previous posts was to maintain a cyclical bias in portfolios but dial down risk pending a new excess money “buy” signal and / or a significant market correction.
