Entries from November 1, 2017 - November 30, 2017
Euroland / UK monetary update - messages unchanged
Euroland monetary trends have cooled slightly, suggesting that GDP growth will moderate in the first half of 2018. UK trends have stabilised after weakness earlier in 2017, consistent with GDP growth continuing at around its recent pace.
As usual, the focus here is on non-financial monetary aggregates, i.e. covering holdings of households and non-financial businesses but excluding financial sector money, which is less relevant for assessing near-term economic prospects.
Six-month growth rates of Euroland non-financial M1 and non-financial M3 rebounded in October but are lower than in 2016 and the first half of 2017 – see first chart. Growth in real terms has been supported by a fall in six-month consumer price inflation but this is probably in the course of reversing – second chart.
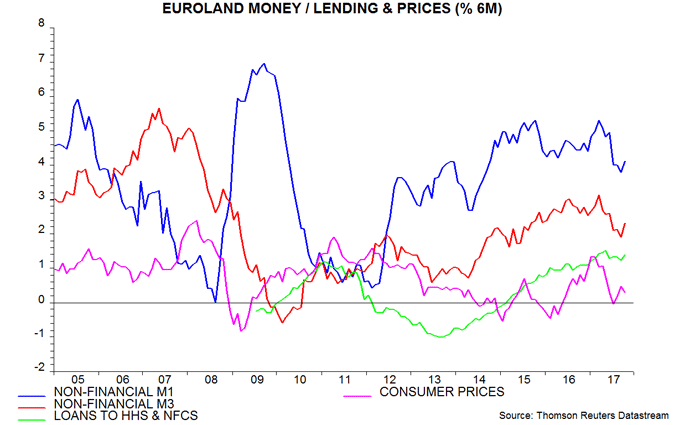
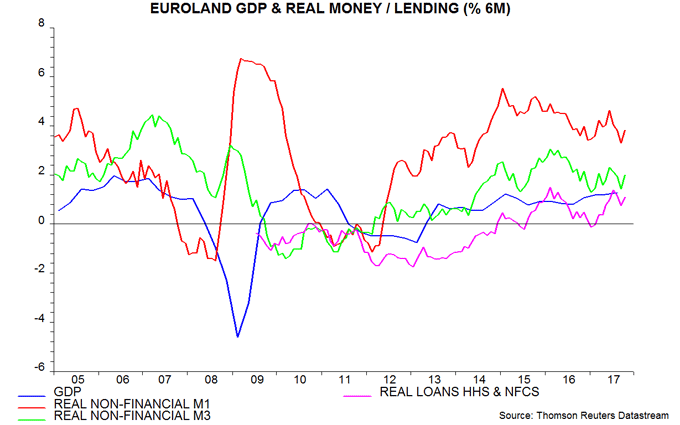
Money trends, it should be emphasised, remain consistent with solid economic growth but activity data surprises may shift from positive to balanced / negative in early 2018.
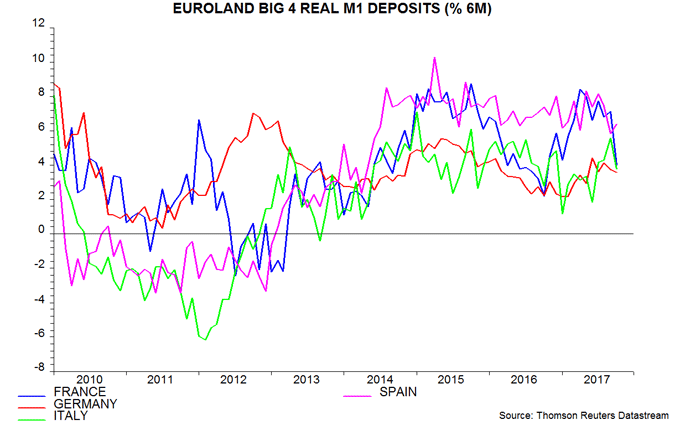
Recent positive surprises have been focused on France. French economic acceleration was signalled by a strong pick-up in real M1 deposit growth in late 2016 / early 2017 but there was a set-back in October – third chart.
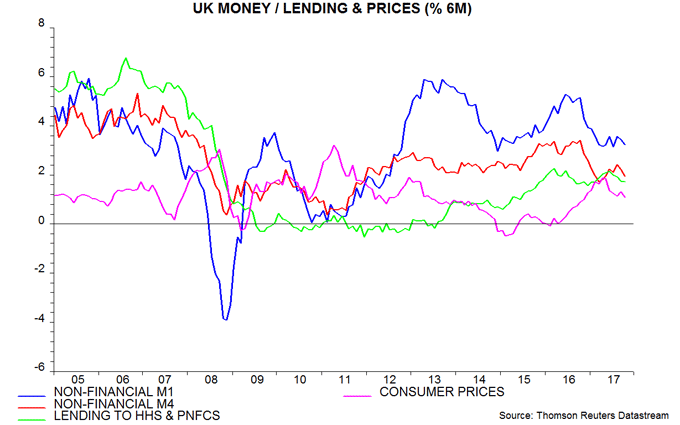
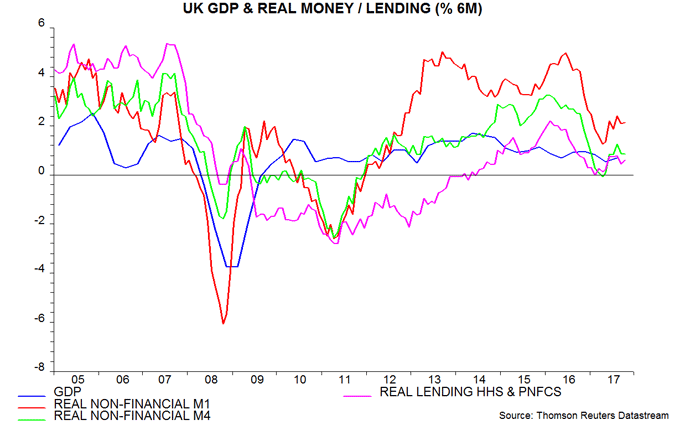
In the UK, six-month growth rates of non-financial M1 and non-financial M4 have moved sideways since the spring after falling in late 2016 / early 2017 – fourth chart. Growth in real terms has recovered slightly as six-month consumer price inflation has moderated – fifth chart.
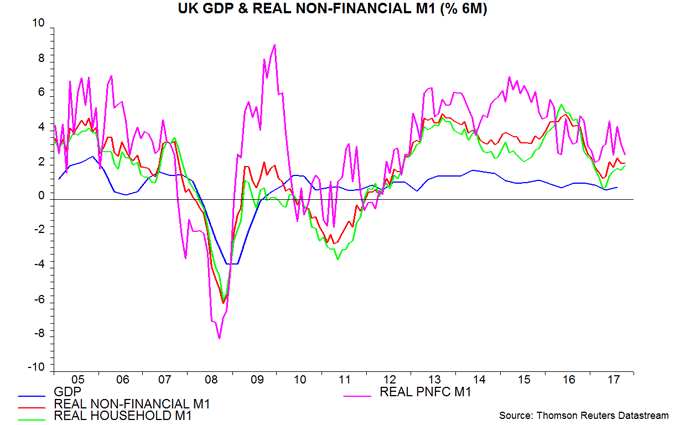
Corporate money trends are of particular interest at present: a Brexit-related cut-back in investment or shift of activity overseas would be expected to be preceded by a slowdown or contraction in real M1 holdings of private non-financial corporations (PNFCs). Such holdings are still rising moderately, while household real M1 growth has recovered slightly, suggesting consumer spending resilience – sixth chart.
Some analysts may express alarm about a recent sharp fall in annual growth of the Bank of England’s M4ex broad money measure – from 7.3% in April to 4.2% in October. About half of this decline is attributable to a slowdown in financial sector money holdings, which is unlikely to be of economic significance. Household M4 growth, meanwhile, has been weakened by a portfolio shift out of bank and building society time deposits (including retail bonds) into investment funds and National Savings products. Retail sales of investment funds and inflows to National Savings totalled an estimated £54 billion in the 12 months to October, equivalent to 2.8% of M4ex, up from £16 billion, or 0.9%, in calendar 2016.
Santa Hammond throws caution to the wind
The Chancellor belied his reputation as a fiscal conservative by announcing a sizeable easing relative to previous plans, allocating the extra cash across a range of supposedly populist measures.
Fiscal policy will be 1.2% of GDP looser in the run-up to Brexit: cyclically-adjusted borrowing is now projected to fall by 0.8% of GDP between 2017-18 and 2019-20 versus 2.0% in the March 2017 Budget.
The Treasury made room for this policy shift by reducing headroom in previous plans, employing accounting tricks – most notably, tweaking housing association regulations to move borrowing off balance sheet – and pushing out the ultimate objective of a balanced budget.
The Chancellor still meets his “fiscal mandate” of a cyclically-adjusted deficit of below 2% of GDP in 2020-21 but the new projection of 1.3% is up from 0.9% in March, implying little protection against Brexit or other risks crystallising.
The OBR downgraded its medium-term growth forecast as expected but is arguably still giving the Chancellor too easy a ride. It continues to assume a smooth Brexit with no negative demand impact on GDP and also ignores the strong possibility that the global economy will enter another downturn by 2020, as suggested by cyclical analysis.
In cash terms, the Budget “gives away” £9.9 billion in 2019-20, with the distribution apparently governed by political expediency rather than economic logic – so £1.1 billion is spent on encouraging fuel and alcohol consumption by freezing duties and £600 million on a further boost to housing demand via stamp duty relief for first-time buyers. The NHS receives an extra £1.9 billion while an additional £1.5 billion is allocated to “preparing for EU Exit”. A modest £300 million is spent on changes to Universal Credit.
There was little for business to cheer: an earlier switch from RPI to CPI uprating for business rates is welcome but the cost will be recouped by ending capital gains indexation, while the housing supply package was underwhelming.
The Chancellor has delivered the Budget apparently demanded by the Prime Minister – one suspects that no. 10 will take any credit while he will suffer the consequences if it flops.
Global money trends / stocks cycle turning less favourable
Six-month growth of global real narrow money appears to have stabilised in October, following a decline between June and September – see first chart. The rise in real narrow money growth into June was the basis for an earlier forecast here that the global economy would reaccelerate in late 2017. The fall over July-September suggests that economic momentum will peak in early 2018 and moderate towards mid-year. Real narrow money growth remains respectable by historical standards, arguing against significant economic weakness within this time frame.

Strong current economic momentum is evidenced by positive data surprises – the Citigroup G10 activity surprise index recently reached its highest level since March – and a surge in upgrades of company earnings forecasts by equity analysts.
The estimated stabilisation of global six-month real narrow money growth in October reflected rises in the US and Japan offset by a further fall in China – second chart. The final estimate will depend importantly on Euroland data to be released on 28 November.

Global real narrow money growth fell significantly between August 2016 and February 2017, contributing to an expectation here that the economy would lose momentum in summer 2017. Economic surprises and earnings revisions turned negative, and G7 government bond yields fell, but GDP / industrial output data remained strong. Why was the monetary signal apparently less powerful on this occasion?
A hypothesis under consideration here is that the significance of changes in monetary trends for future economic activity depends partly on the status of the US / global stockbuilding cycle (the Kitchin cycle). Monetary slowdowns during the upswing phase of this cycle may have muted and / or delayed implications.
The stockbuilding cycle is usually described as having a duration of between three and five years. The judgement here is that cycle troughs occurred in 1995, 1998, 2001, 2005, 2009, 2012 and 2016. The contribution of the change in stockbuilding to the annual rate of change of G7 GDP bottomed in these years – third chart.

Global GDP / industrial output typically accelerates strongly in the year to 18 months after a stockbuilding cycle trough. Monetary slowdowns during this phase may be of less significance for economic prospects than at other times.
This hypothesis is consistent with similar experience after the prior stockbuilding cycle trough in 2012 – global real narrow money growth fell significantly in late 2012 / early 2013 but economic expansion remained strong into early 2014.
The corollary is that economic and market dangers, and the significance of monetary weakness, increase as the stockbuilding cycle matures.
On the dating here, troughs in the stockbuilding cycle since 1995 have been spaced on average 13.5 quarters apart*. Peaks can occur early or late in the cycle but an expectation of a roughly seven quarter spacing from the most recent trough is reasonable in the absence of other information. The judgement that a trough occurred in the first quarter of 2016, therefore, suggests that cycle momentum will start to fade in early 2018.
Major market disturbances in recent decades have usually occurred in the year to 18 months before a stockbuilding cycle trough. Downswings into troughs in 1995, 1998, 2001, 2009, 2012 and 2016 were associated respectively with the Tequila crisis, the Asian crisis / Russian default, the TMT bust, the global financial crisis, the Eurozone crisis and the OPEC / oil price bust. Market conditions remained benign in the run-up to the 2005 trough but this may have contributed to excessive risk-taking and credit expansion in the subsequent upswing.
Based on the average 13.5 quarter spacing since 1995, the next stockbuilding cycle trough could occur in mid-2019, suggesting that investors should batten down the hatches by mid-2018 at the latest – especially if global monetary trends continue to cool.
*Equivalent to 40 months, which equals the average periodicity of cycles in US / UK bank clearings and commodity prices documented by Joseph Kitchin in his original 1923 article.
Chinese money trends suggesting moderate economic expansion
Annual growth of Chinese narrow money – as measured by the true M1 aggregate* calculated here – peaked at 22.1% in August 2016. In line with the normal historical pattern, the peak in narrow money growth was followed by peaks in annual house price inflation (November 2016), industrial profits growth (January / February 2017) and producer price inflation (February 2017) – see first chart.

Annual narrow money growth fell further to 11.6% last month, the lowest since 2015. House price momentum, profits growth and producer price inflation should continue to soften into early 2018.
The issue for analysts is whether the money / credit slowdown signals a normalisation of economic growth and inflation after a period of buoyancy or rising risk of a “hard landing” scenario. Current narrow money trends still suggest the former.
The fall in annual narrow money growth mainly reflects a step-down in the monthly trend in late 2016 / early 2017. The three-month rate of increase has moved sideways since end-2016, suggesting that annual growth will level off soon – second chart.

Annual and six-month narrow money growth remain at levels historically consistent with respectable nominal GDP expansion. Broad money trends are weaker but six-month growth of the preferred measure here, i.e. M2 excluding financial sector deposits but including bank bonds, has recovered since June and is well above the low reached in late 2014, when a “hard landing” was a serious risk – third chart.

After tightening policy during the first half of 2016, the authorities are maintaining a restrictive stance but may ease off in early 2018 as the housing market continues to soften and producer prices slow. Further monetary weakness would be concerning but the current signal remains moderately positive.
*True M1 = currency in circulation plus demand deposits of corporations, government organisations and households. The official M1 measure omits household deposits.
US worker shortage suggesting margin squeeze
US unemployment of 6.52 million in October has almost converged with the number of job openings (vacancies) in the economy, of 6.09 million in September. If the unemployed had the right skills and / or were in the right location, almost all would be in jobs. This is a reasonable definition of “full employment”.
The unemployment rate of 4.1% (4.07% before rounding) compares with a job openings rate of 4.0% (3.98%)*. The gap between the unemployment and job openings rates has fallen below 0.5 percentage points (pp) on only four occasions since the early 1950s – 1955, 1965, 1972 and 1999**. All four instances were followed by a rise in unit labour cost growth. Between the month when the gap fell below 0.5 pp and four quarters later, annual growth of non-farm unit labour costs rose by 6.7 pp, 3.6 pp, 5.0 pp and 2.7 pp respectively.
In 1955, 1972 and 1999, the unemployment rate converged with the job openings rate but did not fall below it. The economy subsequently weakened, the gap rewidened and the rise in unit labour growth was reversed.
In 1965, by contrast, the unemployment rate fell well beneath the job openings rate and a negative gap was sustained through 1970. Annual unit labour cost growth moved up from around zero in 1964-65 to 4% over 1966-68, with a further ratchet higher to 7% in 1969 – see first chart.

Developments since 2012 echo the first half of the 1960s, with annual unit labour cost growth remaining weak despite a steady narrowing of the unemployment rate-job openings rate gap – second chart. The gap fell below 0.5 pp in April 2017, suggesting – based on the historical experience – a rise in unit labour cost growth by mid-2018.

Faster unit labour cost growth would put upward pressure on (core) inflation and downward pressure on profit margins. Either would be negative for markets but the balance would affect the relative attraction of equities and Treasuries. A scenario in which margins took more of the strain, for example, would imply deteriorating economic prospects and rising recession risk, suggesting support for Treasuries despite a near-term inflation increase. Margins have fallen back since 2014 but remain elevated by historical standards – third chart.

*Unemployment rate = unemployment as percentage of employment plus unemployment. Job openings rate = job openings as percentage of employment plus job openings.
**Job openings data from December 2000 from Bureau of Labor Statistics; earlier data based on composite (i.e. print plus online) help-wanted series estimated by San Francisco Fed economist Regis Barnichon.
US bank credit loosening offsetting Fed restraint
Posts in the spring and summer suggested that US economic growth would pick up into early 2018 based on 1) a rise in six-month real narrow money growth into August, 2) an expected upswing in the Kitchin stockbuilding cycle into the first half of 2018 and 3) a loosening of bank credit supply as the negative impact of a temporary tightening of funding markets in 2016 reversed.
The forecast of a positive impulse from bank credit supply is supported by the Fed’s October survey of senior loan officers. An average of the net percentages of banks tightening credit standards across various loan categories (commercial and industrial, commercial real estate, residential mortgages and consumer) fell further, consistent with rising near-term GDP momentum – see first chart.

As previously explained, looser bank credit is temporarily masking the negative economic impact of earlier Fed rate hikes. The danger is that apparent economic resilience will cause the Fed to overtighten over the next six to 12 months, laying the foundation for a recession in 2019-20.
The suggestion that the stockbuilding cycle remains positive for near-term economic prospects, following a 0.7 percentage point contribution to third-quarter GDP expansion of 3.0% annualised, is supported by a further decline in the ratio of inventories to sales in the three months to end-September – second chart.

Six-month real narrow money growth fell back sharply in September, suggesting that economic momentum will peak in early 2018. Weekly data through 23 October, however, indicate a partial rebound last month – monetary trends are not yet giving grounds for pessimism about economic prospects for later in 2018.

