Entries from November 1, 2015 - November 30, 2015
G7 core inflation up again, Japanese exports rebounding
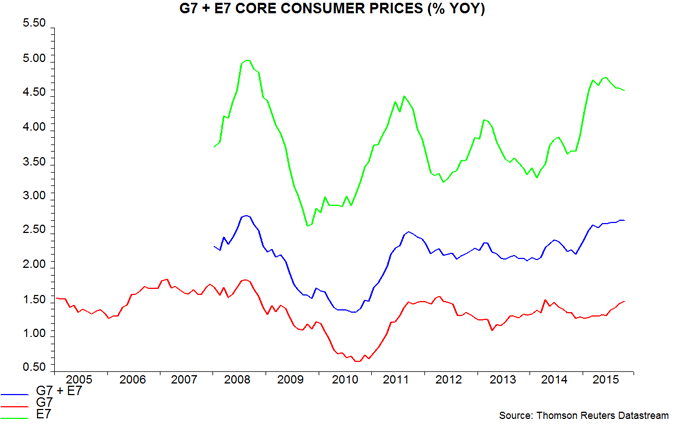
Annual “core” consumer price inflation in the G7 countries and seven large emerging economies is estimated to have remained stable at 2.7% in October, a seven-year high*. A further rise in the G7 was offset by a fall in the E7, where the core rate may have peaked in June – see first chart.
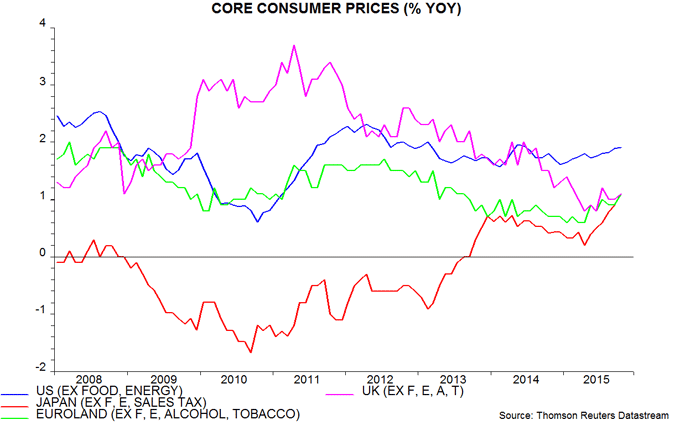
Core inflation has moved up across the major developed economies this year, with the largest rises in Japan and the Eurozone – second chart. The Eurozone core rate has recovered from 0.6% in early 2015 to 1.1%, reflecting higher services as well as goods inflation, with the former increasing from 1.0% to 1.3%. Monetary policy changes take up to two years to have their maximum impact on inflation**, so the recent increase in the Eurozone core rate appears consistent with returning inflation to the target of “below, but close to, 2%” by end-2016. QE and expected further action in December may be laying the foundation for an overshoot in 2017-18.
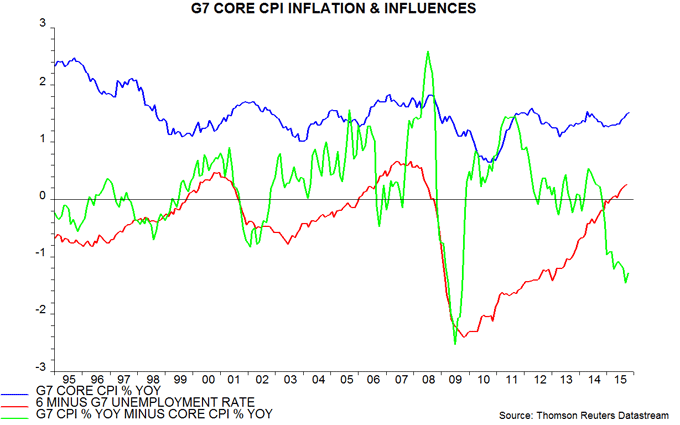
Two key influences on G7 core inflation trends are labour market tightness and pass-through of lower commodity prices, both directly and via temporarily reduced wage pressures. In common with rises in 2000-01 and 2006, this year’s increase in core inflation followed a fall in the G7 unemployment rate below 6% – third chart.
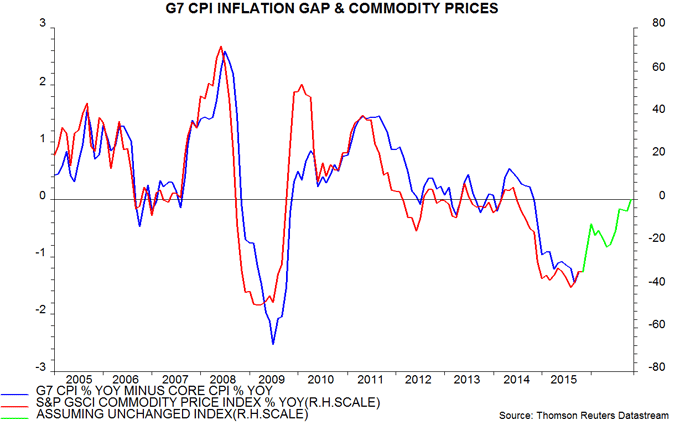
The commodity price influence can be measured by the gap between G7 headline and core inflation, which was recently the most negative since 2009 – third chart. The gap, however, is forecast to narrow sharply in early 2016 and will close by late next year if commodity prices stabilise – fourth chart. Unless labour markets loosen, this suggests further upward pressure on the core rate.
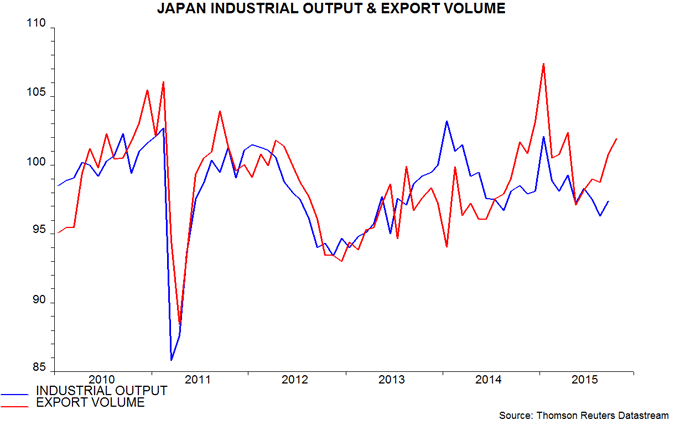
The view that the global economy is regaining momentum, meanwhile, is supported by October Japanese trade numbers, showing export volume up by a further 1.1% last month, consistent with a METI survey forecast of a solid increase in industrial output – fifth chart.
*October available for all countries except Japan and Canada; Japan estimated from Tokyo data, Canada assumed unchanged. Core definition varies slightly across countries but in most cases excludes all food and energy items. See footnote in previous post for details.
**Source: Bank of England.
Chinese money numbers strong again, economy reviving
Chinese economic and monetary data for October support the view that a growth revival is under way and will gather strength into the first half of 2016.
Annual industrial output growth fell back to 5.6% last month, equalling a low in March. Measured over six months, however, output momentum has recovered significantly since then – see first chart.
Annual growth of nominal retail sales rose to 11.0% in October, the highest since December and equivalent to 9.9% in real terms. Private investment weakness, meanwhile, may be abating: annual growth in nominal investment recovered from 6.7% in September to 8.5% last month.
These better signs are consistent with an earlier firming of monetary trends. The six-month rate of change of real true M1* bottomed at end-2014, recovering modestly during the first half of 2015 before surging in the third quarter – first chart. Allowing for a typical nine-month lead, this suggests a further revival in economic momentum in the fourth quarter and significantly stronger growth in the first half of 2016.
An October reading for true M1 is not yet available but six-month growth of real official M1 rose further last month – first chart. Real M2 expansion also strengthened. M2 was boosted by the earlier official operation to support the stock market, with share purchases reflected in a sharp rise in financial deposits. Growth, however, has rebounded even excluding such deposits.
Credit trends have also firmed. Monthly numbers for total social financing and bank loan creation were below market expectations in October but the six-month increases in the respective real stock measures have risen since August – second chart. Bank lending, like M2, was boosted by the stock market price-keeping operation but growth has recovered even excluding loans to financial institutions. Note that recent heavy bond issuance by local governments is not included in the credit aggregates.
Many economists use the rate of change of credit growth – the “credit impulse” – as a leading indicator of the economy. The impulse appears to be turning positive, undermining a key strand of the pessimistic case. (An analysis of G7 data since the 1960s showed that real narrow money provided more reliable signals of future cycle turning points than the credit impulse, with a longer average lead time.)
October government budget figures, meanwhile, confirm a substantial loosening of fiscal policy, with spending up by 36% from a year earlier – third chart.
*True M1 = official M1 plus household demand deposits. Official M1 = currency in circulation plus corporate demand deposits. Real = deflated by consumer prices.


UK labour market still tightening rapidly
UK labour market slack continues to erode more swiftly than forecast by the MPC. The unemployment rate fell further to 5.3% in the third quarter, below a 5.4% estimate in last week’s Inflation Report. The MPC projected that the rate would decline to 5.3% in the fourth quarter and remain there through the third quarter of 2016, based on market-implied interest rates. The single-month number, however, was 5.2% in September and the latest quarterly flow data suggest a near-term further drop: the gross inflow to unemployment hit another post-recession low last quarter, while the gross outflow rebounded after a second-quarter fall.
The unemployment rate fell by 0.7 percentage points between the third quarters of 2014 and 2015 but this underestimates the reduction in labour market slack over this period. There has, in addition, been a significant decline in the number of employees working part-time because they could not find a full-time job, and also in the number of discouraged workers, i.e. people not currently in the labour force but who say they would like regular paid work.
These two additional categories are captured in the U-6 labour underutilisation rate definition used in the US. The equivalent UK measure* fell from 15.9% to 14.9% between the third quarters of 2014 and 2015, i.e. a 1.0 percentage point decline versus the 0.7 point fall in the unemployment rate – see first chart.
The continued erosion of slack suggests that a recent small pull-back in pay growth will prove temporary. The annual increase in regular weekly earnings (i.e. excluding bonuses), smoothed over three months, fell from 2.9% in July to 2.5% in September. The decline can be explained by a reduction in average hours worked per week: expressed at an hourly rate, regular pay growth was unchanged at 3.1% in September – second chart.
*Definition: unemployed plus not in labour force but wanting job plus employed part-time because unable to find full-time job, as percentage of unemployed plus employed plus not in labour force but wanting job.


Global auto sales at record, Chinese exports still outperforming
Strong October auto sales support the assessment here that the global economy is reaccelerating. Aggregate sales, seasonally adjusted, in the G7 and seven large emerging economies (the “E7”) rose to a record last month, reflecting another bumper outturn in the US and a sharp increase in China, following a cut in the sales tax on smaller-engined vehicles from 10% to 5% – see first chart.
Auto sales are a short leading indicator of the economic cycle. The increase since mid-year has coincided with a pick-up in retail sales growth and suggests that a recent recovery in industrial output momentum will extend into end-2015, at least – second chart. Global real narrow money trends, meanwhile, are giving a reassuring message for economic prospects in the first half of 2016 – see previous post.
China bears were energised by October trade numbers, showing a 6.9% annual decline in exports in US dollars, following a 3.7% September fall. Adjusting for the seasonal pattern, however, October exports were little changed from September and 6.9% above the first-half average. Chinese exporters continue to outperform their competitors; German September numbers, for example, show a 9.2% dollar-terms drop from a year before – third chart.
A near-record trade surplus coupled with reduced capital outflows, meanwhile, resulted in a small rise in Chinese foreign exchange reserves last month, following a large fall during the third quarter. The PBOC has been cutting banks’ reserve requirement ratios to offset a liquidity drain from intervention; with currency flows back in balance, the prospect of further reductions is receding.


UK Inflation Report: doves in control - for now
The November Inflation Report is notably more dovish than its August predecessor, mainly reflecting increased MPC concern about slowing emerging economies. The change in tone probably also reflects a desire to minimise upward pressure on sterling should the ECB ease policy further in December.
The change in the MPC’s collective opinion is summarised by the two-year-ahead mean inflation forecast based on unchanged policy, which has been cut from 2.6% in August to 2.3% in November, returning it to its level in May. The implication is that a rate rise is no more urgent now than it was in May.
The 2.6% August forecast chimed with Governor Carney’s July statement that a decision to raise rates would “come into sharper relief around the turn of this year”, i.e. five months later. The November cut in the forecast suggests that a rise is still at least five months away, i.e. next spring at the earliest.
The view here, based on monetary trends, is that global and domestic economic prospects are stronger than the MPC judges. If correct, incoming news should shift the Committee in a hawkish direction by the time of the February Inflation Report.
An additional significant announcement today was new “guidance” that the MPC expects to maintain the stock of asset purchases at £375 billion until Bank rate returns to around 2%. This increases the risk of an abrupt rise in rates since the alternative policy tightening option of early asset sales is no longer available.
Global "core" inflation isn't low
It is widely recognised that current low global consumer price inflation reflects a temporary drag from weak commodity prices. Much commentary, however, asserts that “core” inflation is also unusually subdued. Not so.
The first chart below shows headline and core inflation aggregates for the G7 countries and seven large emerging economies (the “E7”). The core definition varies slightly across countries but in most cases excludes all food and energy items*. The country data were aggregated using GDP weights.
G7 plus E7 headline CPI inflation was 1.7% in September, equal to a low reached in January and the least since October 2009. Core inflation, by contrast, rose to 2.7%, the highest since September 2008.
The elevated core rate mainly reflects E7 strength – second chart. The E7 aggregate has been driven up by surges in core inflation in Russia and Brazil, caused by currency collapses – current core rates are 9.1% and 16.6% respectively. In addition, however, G7 core inflation has been drifting higher and is slightly above its average over the past 10 years – 1.5% versus 1.4%.
Lower commodity input costs and cheaper manufactured imports from weak-currency emerging economies have been pulling down on the G7 core rate, so the observed rise indicates a pick-up in domestic inflationary pressures. G7 labour markets are now relatively tight, with the unemployment rate down by a further 0.6 percentage points to 5.8% over the past 12 months – equal to its level in mid-2006 when G7 core inflation was also rising.
With monetary trends suggesting improving global and E7 economic prospects, commodity prices and E7 currencies may stabilise or recover. If so, G7 core inflation is likely to continue to move higher, while the E7 core rate should moderate as imported price rises slow.
*Japan: additionally excludes impact of 2014 sales tax rise. Brazil: includes some food items. India: includes vehicle fuel, excludes additional items. Russia: includes some food items, excludes additional items.


