
Entries from November 1, 2014 - November 30, 2014
Equities versus cash investment rules: an update
 Simon Ward
 Post a Comment
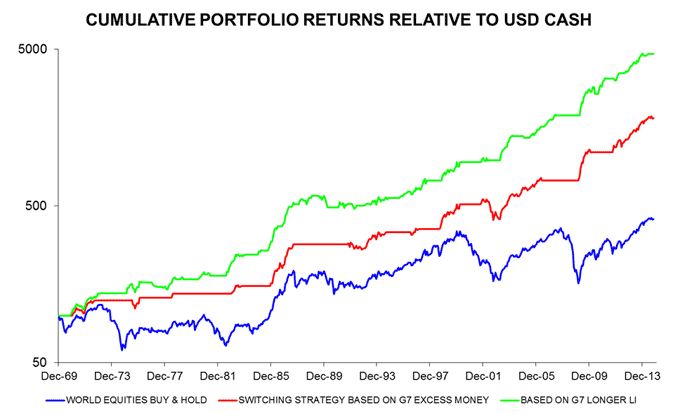
Previous posts have described two simple investment rules for switching between global equities and US dollar cash. As detailed below, one of the rules is positive on equities while the other prefers cash.
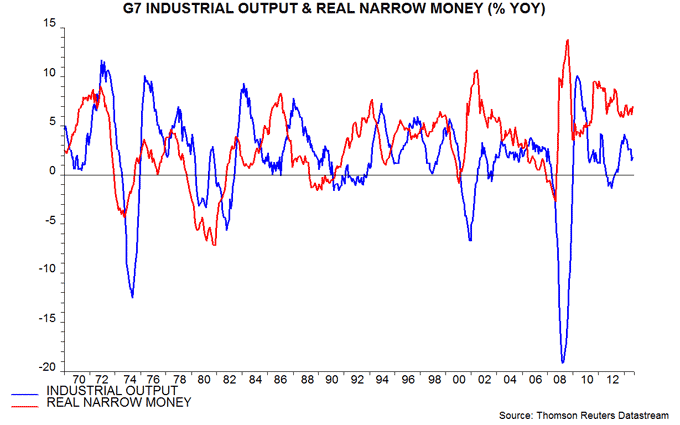
The first rule holds equities or cash depending on whether G7 annual real narrow money supply expansion is higher or lower than industrial output growth. A faster rise in money holdings than output suggests that investors are about to deploy cash in asset markets, pushing up prices. Conversely, a slowdown of money relative to output may signal a deteriorating liquidity backdrop for equities. An investor following this rule over the last 30 plus years would have captured much of the rise in equities while largely avoiding bear markets. The rule outperformed a strategy of buy and hold by 3.5% per annum (pa) between 1969 and 2013 – see first chart*.
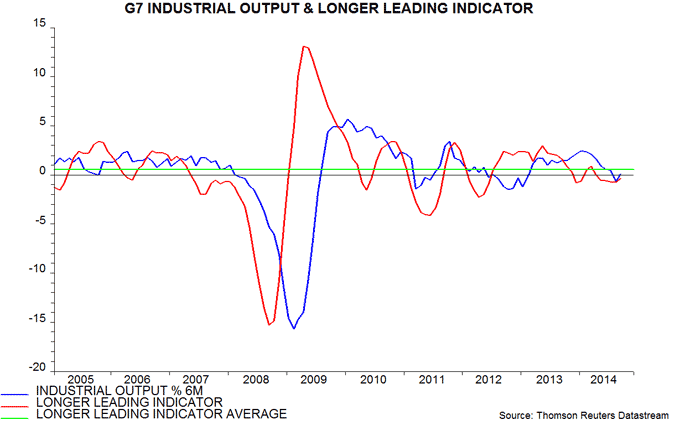
The second rule switches between equities and cash depending on whether the G7 longer leading indicator followed here is above or below its long-run average. The indicator is designed to predict turning points in industrial output growth: a rise through the average signals economic acceleration; a fall below it warns of a slowdown. The backtest performance of the rule is superior to that of the excess money rule; it captures more of the rise in equities and avoids a larger proportion of the bear phases. The rule outperformed buy and hold by 6.0% pa over 1969-2013 – first chart.
These returns are hypothetical because they are based on currently-available data. The excess money results, however, may be realistic, since annual real money and industrial output growth could have been calculated in real time and subsequent data revisions would probably have made little difference to the timing of cross-over signals. By contrast, the leading indicator series incorporates changes over the years in the construction and constituents of the OECD’s country leading indices. Data revisions to these indices, moreover, are sometimes significant. The historical return of the leading indicator rule, therefore, is unlikely to have been achievable in practice.
G7 annual real narrow money expansion has been above industrial output growth since 2011 and the current gap is the widest since August 2013 – second chart. The first rule, therefore continues to favour equities.
The G7 longer leading indicator, by contrast, has been below its long-run average since April, resulting in the second rule being in cash since June** – third chart. The indicator, however, recovered in September, suggesting that the trend is turning.
The rules, it should be noted, are intended to capture the bulk of gains during market upswings while limiting losses during downswings – they rarely signal the exact top of a bull run or bottom of a bear market.
*A six-month lag is applied before buying equities after a positive cross-over.
**Allowing for the release lag.
Some cautionary signals for dollar bulls
“Dollar smashes through resistance as mega-rally gathers pace”, claims the title of an article on telegraph.co.uk. The dollar may be in a longer-term uptrend but its trade-weighted index is testing rather than already through important resistance, while relative economic prospects may be shifting less favourably for the US.
The first chart shows the Bank of England’s trade-weighted dollar index together with the net long position of US “non-commercial” futures market participants in dollar contracts against six other developed market currencies. Three features are noteworthy.
First, the dollar index has reversed nearly 38.2% of its entire decline between 2002 and 2011. 38.2% is an important “Fibonacci” retracement level and often acts as resistance; some technicians, indeed, argue that a change of trend is confirmed only when it is broken. Such confirmation has yet to occur: the 38.2% retracement level of 94.41 compares with a current rally high of 93.94 (on Monday)*. Note also that the Fibonacci level coincides approximately with the 2009 high of 95.08. The 94-95 area, therefore, represents a significant technical barrier.
Secondly, the rise in the dollar index from its 2011 low has occurred in five waves – three sustained upswings separated by two corrective phases. According to Elliott Wave theory, this pattern suggests a completing move that will be followed by a more significant correction than the prior two set-backs.
Thirdly, the futures market net long position is at the top of its historical range. The position reached similar extremes at the end of the prior two upswings since 2011. It was similar in magnitude but opposite in sign at the 2011 low. Futures market participants, at least, appear already to have bought in fully to the “mega-rally” story.
Technical considerations, of course, can be blown away by “fundamentals”. The consensus view is that US economic health and rising wage pressures will ensure Fed tightening in 2015, while the ECB and even the Bank of Japan will be forced to ease further in response to limp growth and deflation risks. Monetary trends, however, question this scenario: six-month growth of real narrow money is solid and rising in the Eurozone and is recovering in Japan but has fallen in the US since mid-2014 – second chart**. US economic growth may disappoint (again) in 2015 while the Eurozone / Japan could outperform current low expectations.
*Any break needs to be sustained for several days to be considered valid.
**The chart includes October estimates for the US and Japan.
Japanese QE may remain ineffective without reserves rate cut
The Bank of Japan (BoJ) has expanded QE to include equities using the Government Pension Investment Fund (GPIF) as a conduit. The BoJ will raise its rate of Japanese government bond (JGB) purchases by ¥30 trillion per annum, financed partly by creating more bank reserves. It will buy most of these securities from the GPIF, which plans to sell about ¥25 trillion of domestic bonds to reduce its portfolio allocation from 55% at end-June to a new target of 35%. The GPIF will use the cash received from the BoJ to buy about ¥20 trillion of domestic and foreign equities to reach new target allocations of 25% each, up from 18% and 16% respectively at end-June. With the BoJ planning to plough an additional ¥2 trillion into equity exchange-traded funds, the net impact is that the Japanese official sector (i.e. BoJ and GPIF combined) will remove about ¥11 trillion or $100 billion each of domestic and foreign equities from circulation, paying for these mainly by creating reserves. The combined ¥22 trillion or $200 billion is equivalent to 4.5% of Japanese annual GDP or 0.5% of the market capitalisation of the MSCI All Country World index.
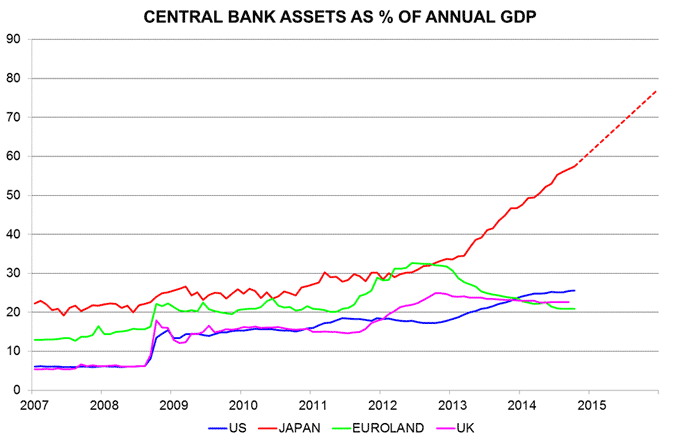
The expansion of QE will extend the divergence between the balance sheet sizes of the BoJ and other major central banks. The BoJ’s assets are on course to rise from 57% of GDP now to more than 75% by end-2015. This compares with 26% for the Federal Reserve, 21% for the European Central Bank (ECB) and 23%* for the Bank of England currently – see first chart. (The BoJ, however, is some way from overtaking the Swiss National Bank, with assets of 82% of GDP.)
Japan’s new QE-equities (QEE) policy has boosted markets but will it prove any more effective than bond purchases in generating nominal economic expansion? Success is judged here to depend on whether the new policy lifts monetary growth. As previously explained, Japanese QE to date has had a negligible monetary impact because 1) the increase in bank reserves has caused banks to cut their JGB holdings, offsetting the effect of the BoJ’s purchases, and 2) an expected weakening of the yen has caused an outflow of money to other countries. Both “leakages” should continue under QEE.
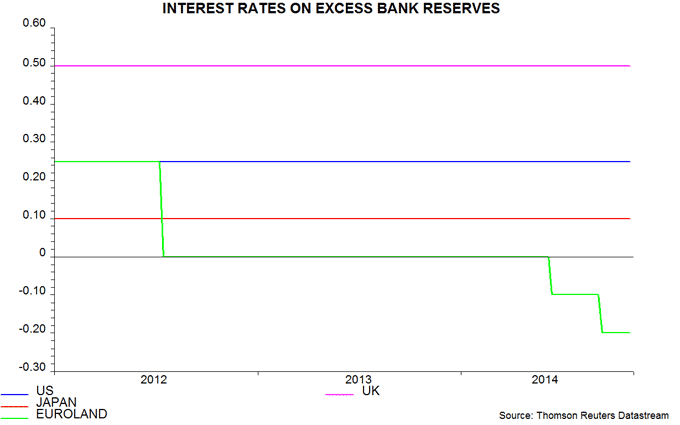
The popular view is that BoJ policy easing has been more radical than that of the ECB, implying a greater chance of success. This is questionable. Japanese bank reserves are ballooning, in contrast to a fall in the Eurozone, but banks are not using this liquidity to expand their lending or investments, partly because the BoJ continues to pay a 0.1% interest rate on excess reserve balances. The BoJ, in this respect, has followed the Fed and Bank of England; the ECB, by contrast, is penalising banks for holding excess reserves, via its -0.2% deposit rate – second chart. The BoJ, in other words, is focusing on the quantity of reserves while the ECB is targeting their velocity of circulation. It remains to be seen which approach is more effective, although Eurozone money measures have risen sharply since a negative deposit rate was imposed in June – see previous post.
The 5-4 split on the BoJ’s Policy Board suggests that QEE represents the last throw of the monetary dice for Governor Kuroda. Has he misjudged by choosing to use his remaining capital to expand QE rather than cut the reserves rate?
*September estimate: no update will be available until late 2015 because of the Bank of England’s decision to end timely reporting of its assets – see previous post.
