Entries from May 1, 2023 - May 31, 2023
UK inflation: don't panic
 Simon Ward
 2 Comments
Market reaction to UK April CPI numbers focused on the overshoot of headline and core inflation relative to forecasts, ignoring a continued slowdown in headline price momentum.
The six-month rate of increase of headline prices, seasonally adjusted here, fell to 6.6% annualised in April, the slowest since September 2021 and down from a peak 12.6% – see chart 1.
Chart 1

Six-month headline momentum is tracking a simplistic “monetarist” forecast that assumes a two-year lag from money to prices and the same “beta” of inflation to money growth as on the way up.
This forecast suggests a further decline in six-month momentum to about 5% annualised in July on the way to much lower levels in late 2023.
The projection of a fall to 5% or so in July is supported by a bottom-up analysis incorporating the announced 17% cut in the energy price cap that month.
Markets were spooked by annual core inflation reaching a new high of 6.8% in April but it is normal for core to lag headline at turning points.
The April result, moreover, is consistent with a mean historical lag of 26 months between peaks in annual broad money growth and core inflation: money growth continued to rise into February 2021 – chart 2.
Chart 2

The suggestion that core inflation is at or close to a peak is supported by PPI data: core PPI output inflation usually leads and has slowed significantly from a May 2022 peak – chart 3.
Chart 3

PPI data also indicate that CPI food inflation is peaking and could fall rapidly over the remainder of the year – chart 4.
Chart 4

Navigating a coming turn in the stockbuilding cycle
The stockbuilding cycle is on course to bottom soon and upturns have historically been associated with a procyclical shift in market behaviour. Several considerations, however, argue for caution about positioning for such a shift now.
The key indicator used to monitor the cycle here is the annual change in G7 stockbuilding expressed as a percentage of GDP, shown in chart 1. Lows were reached every 3 1/3 years on average, which matches the 40-month periodicity reported by the “discoverer” of the cycle, Joseph Kitchin, in 1923.
Chart 1

The stockbuilding cycle is a key driver of industrial fluctuations: the correlation coefficient of the above series and contemporaneous G7 annual industrial output growth over 1965-2019 was 0.75.
The last cycle low was in Q2 2020 so the next could occur in H2 2023, based on the average cycle length. Partial Q1 information – an estimate is included in chart 1 – indicates that the downswing is well advanced, consistent with the cycle entering a window for a low.
Cycle lows often mark a change in the market environment from risk-off / defensive to risk-on / cyclical, e.g. the price relative of cyclical equity market sectors versus defensive sectors has bottomed around the same time as the cycle historically – chart 2.
Chart 2

So should investors start adding cyclical exposure? There are several reasons for caution.
First, stockbuilding has fallen sharply but only to a “normal” level by historical standards. Further weakness seems likely given the extent of overaccumulation in 2021-23.
Second, a monthly inventories indicator derived from business surveys, which is more timely and usually leads by several months, has yet to signal a turning point – chart 3.
Chart 3

Third, and most importantly, stockbuilding cycle recoveries historically were preceded by a pick-up in real narrow money momentum, which remains very weak – chart 4.
Chart 4

The price to book relative of non-tech cyclical sectors versus defensive sectors is below its long-run average but the divergence is smaller than at most recent stockbuilding cycle lows – chart 5.
Chart 5

There is a risk of another bout of market weakness / cyclical underperformance as the stockbuilding cycle moves into a trough. The judgement here is that a revival in real money momentum is necessary to signal that a cycle low will be followed by a sufficiently solid recovery to boost cyclical assets.
Inflation leading indicators still softening
It might be expected that G7 central bankers, in attempting to judge inflation prospects and the appropriate policy stance, would be paying close attention to indicators that signalled the recent inflationary upsurge.
Such indicators include:
-
Broad money growth, which led the inflation increase by about two years.
-
The global manufacturing PMI delivery speed index, a gauge of excess supply / demand in goods markets, which led by about a year.
-
Broad commodity price indices, such as the S&P GSCI, which displayed a sharp pick-up in momentum six to 12 months before the inflation upsurge.
Indicators that provided little or no warning of inflationary danger include measures of core price momentum, wage growth, labour market tightness and inflation expectations, i.e. indicators previously cited to argue that an inflation rise would be “transitory” and now being used to justify continued policy tightening.
Chart 1 shows G7 CPI inflation together with the three informative indicators listed above, with appropriate lags applied.
Chart 1

The three indicators have fallen far below pre-pandemic levels, suggesting that CPI inflation rates will return to targets – or undershoot them – in 2024.
Core inflation and wage growth moved up more or less in tandem with headline inflation during the upswing. Hawkish central bankers need to explain why they expect an asymmetry on the way down.
A possible “monetarist” argument for inflation proving sticky is that the stock of money remains excessive relative to the price level. The judgement here is that any overhang is small and – with monetary aggregates stagnant / contracting – will soon be eliminated.
The G7 real broad money stock is 3% above its 2010-19 trend, down from a peak 16% deviation in May 2021 – chart 2.
Chart 2

While agreeing on the destination, the indicators are giving different messages about the speed of decline of inflation.
The PMI delivery speed indicator and commodity prices are more relevant for goods prices, with recent readings consistent with the expectation here of goods deflation later in 2023.
Broad money trends, by contrast, suggest a temporary slowdown in the rate of decline of CPI inflation during H2, reflecting a stabilisation of money growth during H2 2001. This resulted from a reacceleration of US broad money following disbursement of a third round of stimulus payments.
A possible reconciliation is that the bulk of a fall in services inflation will be delayed until 2024. Such a scenario would suggest a slower reversal of policy rates and an extension of real money weakness, with negative economic implications.
UK MPC policy pivot approaching as labour market cracks
Commentators have expressed scepticism about a large monthly fall in the “experimental” PAYE employees measure in April (136,000 or 0.45%, equivalent to a 700,000 drop in US non-farm payrolls).
It is true that initial estimates are often revised significantly but the largest upward adjustment to the month-on-month change historically was 121,000, relating to a pandemic-distorted month (March 2021*). The mean absolute revision over the last year was 34,000.
The recent trend, moreover, has been for downgrades – the initially estimated month-on-month change has been revised lower for five of the last six months.
The reported fall is consistent with the latest KPMG / REC Report on Jobs: the permanent placements index in April was the lowest since the start of 2021 and the PAYE measure last declined in February 2021 (based on current vintage data).
The regional breakdown of the PAYE measure shows falls in all 12 regions, with the largest (1.0%) in London – also consistent with the Report on Jobs, which reported that permanent placements weakness was led by London.
As the chart shows, the PAYE employees measure correlates with the quarterly employee jobs series, which has “official” status but is less timely – an end-Q1 number will be released next month. (This series, like US payrolls, counts positions rather than people.)

The Labour Force Survey employment measure rose by 182,000 in the three months to March from the previous three months but self-employment and part-time employees accounted for the increase – the number of full-time employees fell.
A post last week suggested that employment would begin a sustained decline in Q2, based on recent weakness in vacancies. The official vacancies series – a three-month moving average – fell again in April. The single-month number calculated here is now down 20% from peak (April 2022), with the month-on-month decline accelerating last month. (The FT incorrectly reported that vacancies stabilised in April.)
Another labour market report is due before the MPC’s next meeting on 22 June. Confirmation that employment is on a falling trend would transform the policy debate.
*The revision to the month-on-month change reflected a downgrade to the level of employment in February, not an upgrade to March.
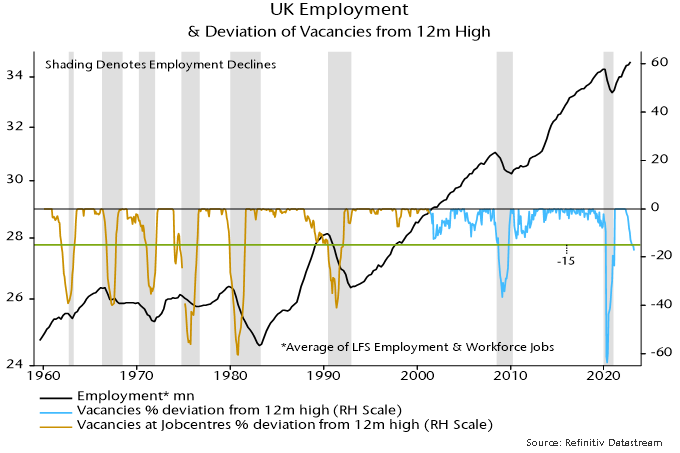
Recession warning from UK vacancies
UK vacancies – like US job openings – are signalling an employment recession.
A previous post noted that a fall in US job openings of more than 15% from a rolling 12-month high was always (since the 1950s) associated with a multi-month fall in payrolls. The 15% threshold was crossed in February data released last month, with the shortfall increasing to 18% in March.
It turns out that the 15% rule also works in the UK, correctly signalling all eight employment recessions since the 1960s with no false warnings. Recent developments mirror the US: the decline in vacancies from peak crossed 15% in January, rising to 17% in March.
The official vacancies series, based on a survey of employers, starts in 2001. Earlier numbers are available (back to 1960) for vacancies notified to Jobcentres. When the latter series was replaced in 2001, Jobcentre vacancies accounted for about 60% of the total. The analysis here combines the two series, effectively assuming that Jobcentre vacancies were a constant proportion of the total before 2001.
Employment recessions were defined as multi-quarter declines in an average of two series – total employment (from the Labour Force Survey of households) and workforce jobs (based mainly on a survey of employers). The latter series – like US non-farm payrolls – counts positions rather than workers and is about 10% larger, reflecting multiple job holding.
As in the US, the 15% threshold was usually reached around the time that employment started to decline, although this may not have been immediately apparent because of reporting lags and revisions.
A Q1 reading of the total employment series is not yet available but LFS data through February and PAYE employee numbers suggest another rise. Based on the vacancies signal, a sustained decline may begin in Q2.
Capex weakness to drive PMI double dip
The global manufacturing PMI new orders index – a timely indicator of global goods demand – was little changed below 50 (49.4) in April, a weaker result than had been suggested by DM flash results.
Inventories indices for finished goods and production inputs, meanwhile, rose further to their highest levels since November. Accordingly, new orders / inventories differentials – which often lead at turning points – fell for a second month.
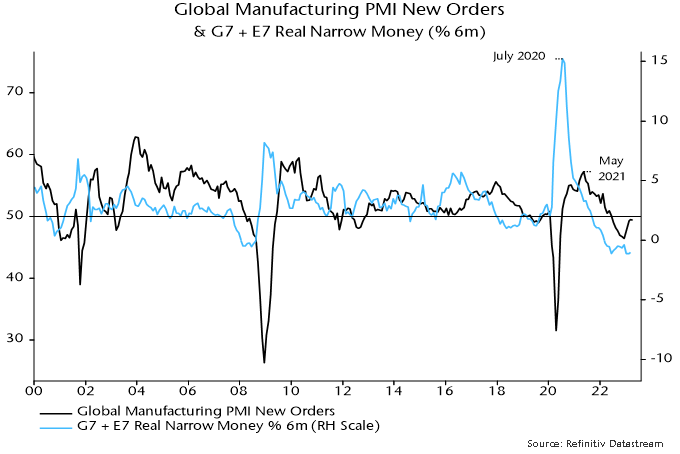
These results are consistent with the forecast here that a recovery in PMI new orders since December 2022 would fizzle out in H1 and reverse into H2, with a possibility of a break below the December low. The basis for the forecast was a relapse in global (i.e. G7 plus E7) six-month real narrow money momentum around end-2022. Real money momentum moved sideways in March at around its June 2022 low – see chart 1.
Chart 1
A downswing in the stockbuilding cycle was a key driver of earlier PMI weakness. A further drag is in prospect but the down phase of the cycle is well advanced, with incoming data and average cycle length suggesting a low during H2.
Business capex is emerging as a new source of global goods demand weakness. The capital goods component of PMI new orders reached a new low in April – chart 2.
Chart 2
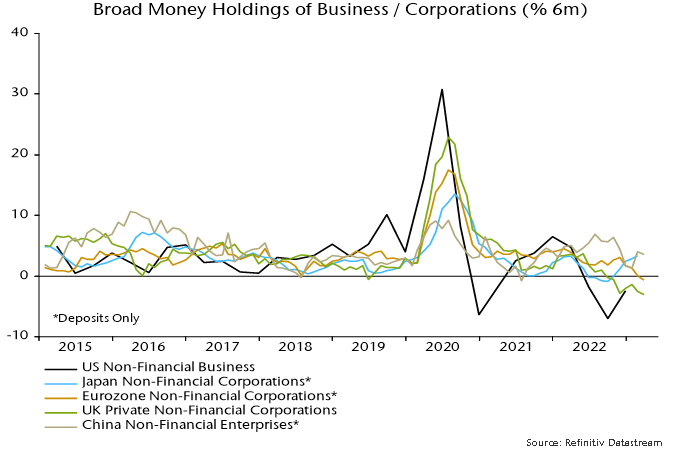
A contraction in business investment is consistent with a squeeze on real profits in late 2022 – chart 3 – and weak corporate money trends: business broad money holdings have fallen in nominal terms recently in the US, Eurozone and UK – chart 4.
Chart 3
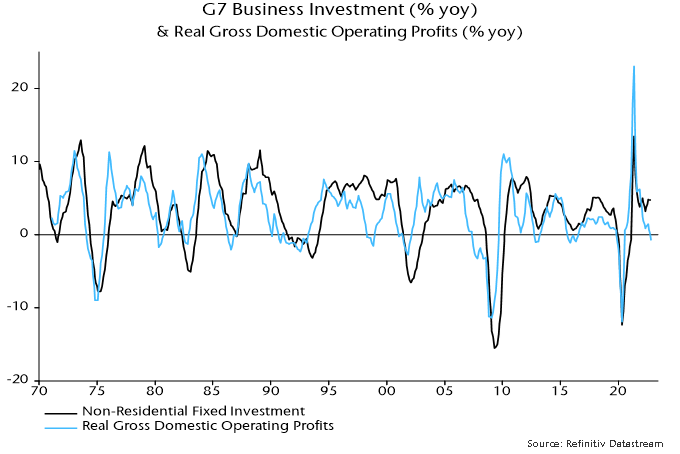
Chart 4
Other evidence of a capex downturn includes:
-
Weak capex intentions in regional Fed manufacturing surveys (and the NFIB small firm survey) – chart 5.
-
Weak enterprise loan demand for fixed investment in the ECB bank lending survey – chart 6.
-
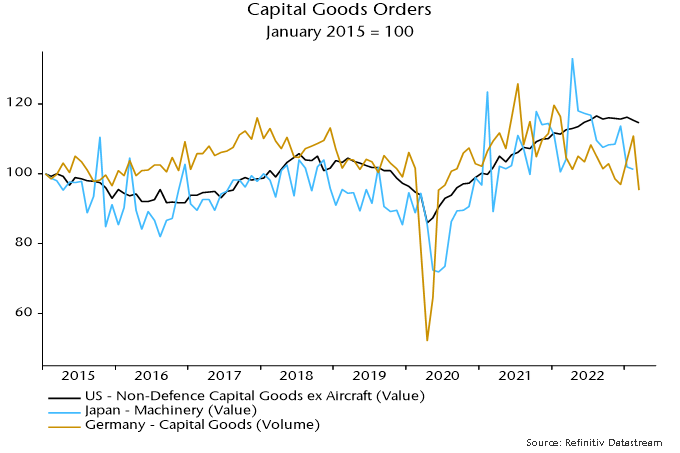
Falling capital goods / machinery orders in the US, Japan and Germany – chart 7.
Chart 5
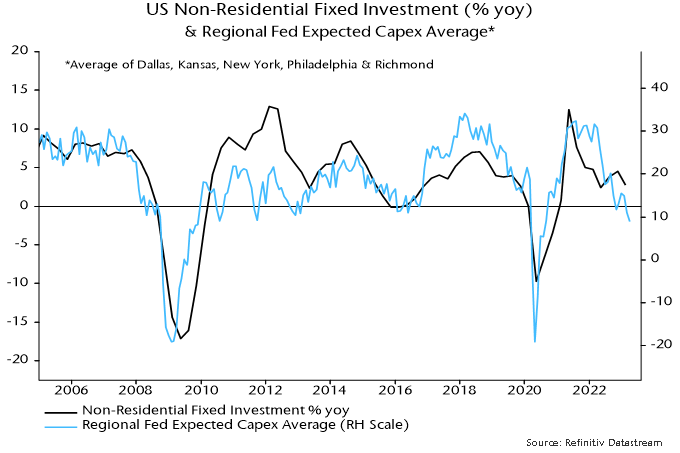
Chart 6
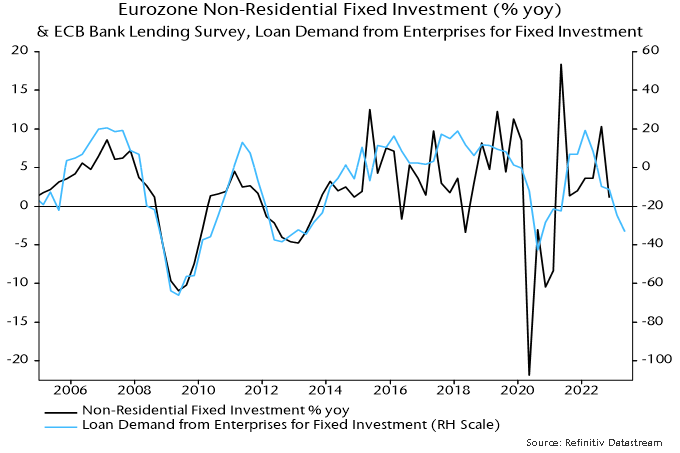 Chart 7
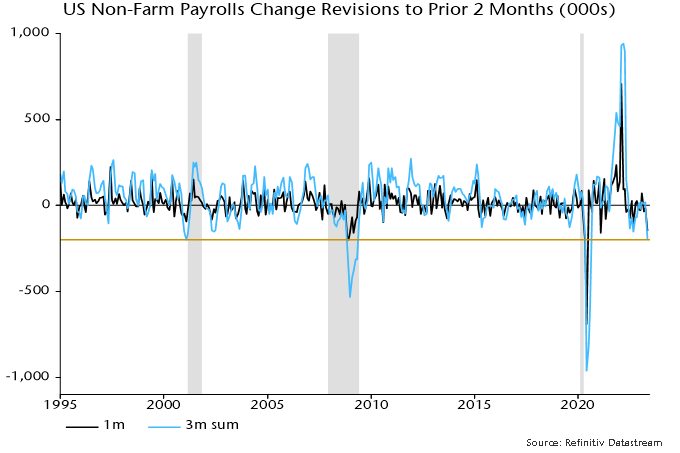
Capex retrenchment is usually accompanied by a fall in labour demand. Adjusted for negative revisions to the prior two months, the addition to US non-farm payrolls in April was 104,000, the smallest since January 2021 – chart 8. Revisions in the last three reports cumulate to -200,000, a level rarely reached outside recessions – chart 9.
Chart 8
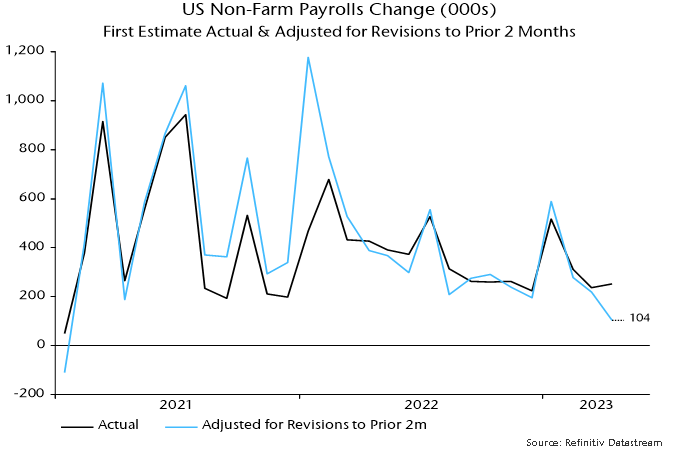
Chart 9