
Entries from May 1, 2022 - May 31, 2022
"Don't just do something, stand there!"
 Simon Ward
 Post a Comment
Recent UK monetary trends are consistent with a medium-term return of inflation to target, implying that the Bank of England should hold policy even though current inflationary pressures will be slow to fade and the consensus will claim that it is “behind the curve”.
The alternative would be to exacerbate a severe squeeze on real money balances that – on the view here – already guarantees a GDP recession.
Satisfactory inflation performance in the five years before the pandemic was a consequence of low and reasonably stable money growth. Three-month expansion of the preferred broad aggregate here, non-financial M4*, averaged 4.4% annualised, mostly fluctuating between 2% and 7% – see chart 1.
Chart 1

The covid shock arguably warranted policy action to move money growth temporarily to the top of this range. Instead, the Bank’s grotesquely miscalibrated QE programme drove three-month growth to 31% annualised in May 2020. A subsequent sharp slowdown was followed by a rise to a second peak of 15% in January 2021 following an incomprehensible decision to extend QE in November 2020.
Three-month growth, however, has been back inside the pre-pandemic range since July last year – it was 4.2% annualised in April.
Monetary trends have yet to reflect fully recent policy tightening. The April-only numbers hint at further weakness: non-financial M4 rose by only 0.2% on the month, while non-financial M1 was flat.
The latest three-month increase of 4.2% annualised may overstate underlying growth because of retail investors switching out of mutual funds into bank and building society deposits in response to recent market losses. A broader savings measure including National Savings, foreign currency deposits and retail mutual funds grew by an estimated 2.9% annualised in the three months to April**.
A further rise in consumer price momentum, meanwhile, has intensified the squeeze on real money balances. Non-financial M4 and M1 fell by 3.4% and 3.3% (not annualised) respectively in the six months to April – chart 2.
Chart 2

Although three-month money growth has been running at a target-consistent pace for several quarters, the usual “long and variable lag” suggests that a normalisation of inflation may be delayed until late 2023 or 2024.
Economists were last week debating whether Chancellor Sunak’s latest cost of living support package would add to inflationary pressures. The net cost of £10 billion equates to only 0.4% of non-financial M4, i.e. the package won’t shift the dial on monetary trends and, by extension, inflation prospects even if fully financed via the banking system (unlikely).
*M4 holdings of the household sector and private non-financial corporations.
**This assumes zero net purchases of retail mutual funds in April, following net sales in February and March.
More recessionary monetary news
Incoming monetary data continue to give an ominous message for near-term global economic prospects while suggesting major inflation relief in 2023-24.
Fed numbers released on Tuesday confirm that the US broad money aggregate tracked here* fell month-on-month in April, resulting in the three-month change turning marginally negative. Weekly data on currency in circulation, commercial bank deposits and money funds suggest another decline in May.
Monthly growth in Eurozone broad money**, meanwhile, was today reported to have fallen to 0.1% in April, pulling three-month expansion down to 3.7% annualised – see chart 1.
Chart 1

Three-month growth rates of narrow and broad money are now below pre-pandemic averages (i.e. over 2015-19). The ECB should wait to see if money growth rebounds before hiking rates but appears to be set on hawkish autopilot, with potentially disastrous consequences.
Three-month growth of loans to households and non-financial corporations remains solid but is below its peak and expected here to slow further as demand for inventory financing falls off and higher mortgage rates curb housing credit.
The slower expansion of broad money than lending mainly reflects a fall in banks’ net external assets – the counterpart of a basic balance of payments deficit – and an increase in their capital reserves. The Ukraine conflict is likely to have boosted capital outflows while causing banks to become more risk-averse. ECB purchases of government securities remained substantial in the three months to April, at the equivalent of 0.7% of broad money, or 2.7% at an annualised rate. Further monetary weakness is likely as this support ends.
The slump in US and Eurozone nominal money growth implies a severe squeeze on real money balances, given current high inflation – consumer prices rose by 9.9% and 10.9% annualised respectively in the three months to April.
The current six-month rate of contraction of Eurozone real narrow money was exceeded only in 1973-74 and the early 1980s. Smaller declines in 1991, 2007 and 2011 also foreshadowed recessions – chart 2. There is stiff competition for the prize of worst recent official forecast but the March ECB staff projection that Eurozone GDP would grow by 4% annualised in Q2 / Q3 is a strong contender.
Chart 2

*”M2+” = M2 + large time deposits at commercial banks + institutional money funds
**Non-financial M3
Why has US money growth slowed?
US broad money growth has slowed significantly despite a strong pick-up in bank lending expansion. How has this occurred and does lending strength portend a rebound in money growth?
The broad money aggregate calculated here* rose by 2.6% (5.2% annualised) in the six months to April, down from 4.5% (9.2%) in the prior six months – see chart 1. All the growth over the last six months occurred over November-January: the aggregate has flatlined over the last three months.
Chart 1

The monetary slowdown contrasts with further strength in bank lending. Commercial bank loans and leases, adjusted for Payment Protection Program forgiveness, grew by 6.5% (13.5% annualised) in the six months to April, up from 3.3% (6.6%) in the previous six months.
Q. What happened to the additional deposit money created by the expansion of banks’ loan books?
A. It was mostly diverted into the coffers of the US Treasury.
Political wrangling over raising the debt ceiling resulted in the Treasury running down its cash balance at the Fed from over $800 billion in mid-2021 to below $100 billion by December. This monetary injection boosted broad money growth late last year.
Since the ceiling was raised in December, the Treasury has “overfunded” the federal deficit to replenish its cash balance, which currently stands at over $900 billion.
The monetary inflow to the Treasury amounted to 2.7% of broad money in the six months to April – chart 2.
Chart 2

The monetary slowdown has also reflected – to a lesser extent – the wind-down of QE: securities purchases by the Fed were 1.7% of broad money in the six months to April, down from 3.4% in the prior six months.
Adding together the effects of QE and changes in the Treasury’s cash balance, there was a net monetary withdrawal of 1.0% of broad money in the six months to April, following an injection of 6.2% in the previous six months. This reversal more than offset the monetary impact of stronger bank lending expansion.
What happens next?
The Treasury’s latest financing projections assume a cash balance of $650 billion at end-September, representing a fall of about $310 billion from its level at end-April.
The Fed, meanwhile, plans to reduce its securities holdings at a monthly pace of $47.5 billion starting in June rising to $95 billion in September. This suggests cumulative QT of about $330 billion over the six months to October.
In combination, QT and changes in the Treasury’s cash balance may, therefore, result in a net monetary withdrawal of only about $20 billion, or 0.1% of broad money, in the six months to October, down from $280 billion or 1.0% in the six months to April.
In terms of the combined influence of the Treasury and Fed, QT effectively started in January and is about to slow temporarily before stepping up later in the year – assuming no further change in the Treasury’s cash balance beyond the expected fall to $650 billion and an ongoing $95 billion per month reduction in the Fed’s securities holdings.
Will a temporarily reduced “public sector” drag allow broad money growth to recover into H2?
The forecast here is that this small positive will be outweighed by a slowdown in bank lending. Corporate credit demand has been boosted by inventory financing but the stockbuilding cycle is now entering a downswing. Higher mortgage rates will cool demand for real estate loans, while banks may rein back on consumer lending as economic prospects deteriorate.
The suggestion of a lending slowdown is supported by the April Fed senior loan officer survey: the aggregate credit demand indicator fell sharply while the net percentage of banks tightening loan standards rose for a third successive quarter – chart 3.
Chart 3

*”M2+” = M2 + large time deposits at commercial banks + institutional money funds. M2 = currency + demand deposits + other liquid deposits + small time deposits + retail money funds. April estimated.
Recession-consistent real money weakness
Global* six-month real narrow money momentum turned negative in March and is estimated to have fallen slightly further in April, based on monetary and CPI data covering two-thirds and 90% of the aggregate respectively – see chart 1.
Chart 1
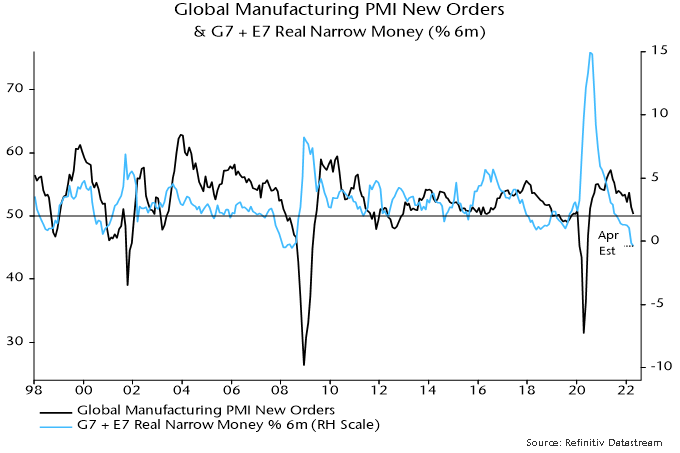
Current weakness is more pronounced than before the 2001 recession and almost on a par with early 2008 before the escalation of the financial crisis.
The leading relationship with the global manufacturing PMI new orders index suggests a sizeable further decline in the latter with no recovery before Q4. A move below 45 would confirm a recession.
The further fall in real narrow money momentum in April reflected another rise in global six-month CPI inflation, with small CPI slowdowns in the US and Eurozone more than offset by pick-ups in China, Japan (Tokyo data) and the UK (estimated), among others – chart 2.
Chart 2
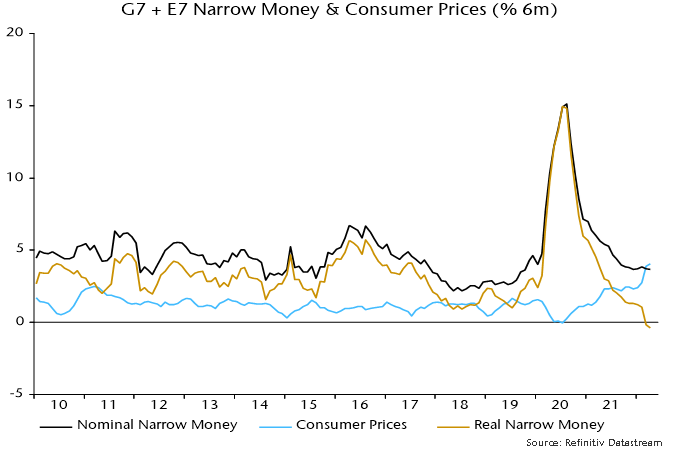
Six-month nominal narrow money growth has been moving sideways since December. With CPI inflation probably peaking, real money momentum could be bottoming. Any recovery, however, could be limited by a renewed nominal money slowdown as central bank policy tightening proceeds.
*G7 plus E7. E7 defined here as BRIC plus Korea, Mexico and Taiwan.
UK recession now odds-on
Six-month growth rates of UK narrow and broad money – as measured by non-financial M1 / M4 – fell in March. With six-month consumer price momentum rising further, real rates of change moved deeper into negative territory – see chart 1.
Chart 1

The six-month contraction in real narrow money in March was slightly larger in the Eurozone than the UK – chart 2 – but UK weakness will intensify in April as CPI momentum is boosted further by the rise in the energy price cap . Eurozone six-month CPI momentum, by contrast, eased slightly last month, according to flash data.
Chart 2

Expressed at an annualised rate, UK six-month broad money growth was 4.2% in March, close to a 4.5% average over 2015-19 and a pace that, if sustained, would ensure medium-term compliance with the 2% inflation target.
A six-month contraction in real narrow money of the present scale was historically a reliable indicator of future economic weakness but did not always signal a recession.
A recession probability model was previously developed here combining monetary information with a range of other financial variables. Based on end-March data, the model estimates the probability of a recession in 2022 at 70% - chart 3.
Chart 3

The probability estimate is derived from an equation for the annual change in gross value added (GVA) including the following variables: real narrow money, real broad money, real broad money held by private non-financial corporations, short- and long-term interest rates, short- and long-term credit spreads, real share prices (FTSE local UK), real house prices and the effective exchange rate. Adjustments were made for the impact of strikes and the 1974 three-day week. The equation was estimated on data up to end-2019 to avoid the covid shock / recession.
The model "explains" the annual GVA change three quarters ahead using current and lagged values of the inputs. The recession probability estimate refers to the likelihood, based on the model, of a negative annual GVA change three quarters ahead, i.e. the 70% estimate refers to Q4 2022. (A negative annual change is a stricter requirement than the conventional recession definition of successive quarterly falls in GDP / GVA.)
Monetary relief for bonds?
Global six-month real narrow money growth fell to zero in March*, the weakest since the GFC and a level historically consistent with recession – see chart 1. (The current reading matches a low before the 2001 recession.)
Chart 1

A rebound in six-month industrial output growth, meanwhile, extended in March, reflecting a production catch-up from weakness in H2 2021 due to supply-side constraints. The negative real money / output growth gap, therefore, widened further.
The March fall in real money growth was driven by a further spike higher in six-month consumer price momentum. Nominal money growth was little changed – chart 2.
Chart 2

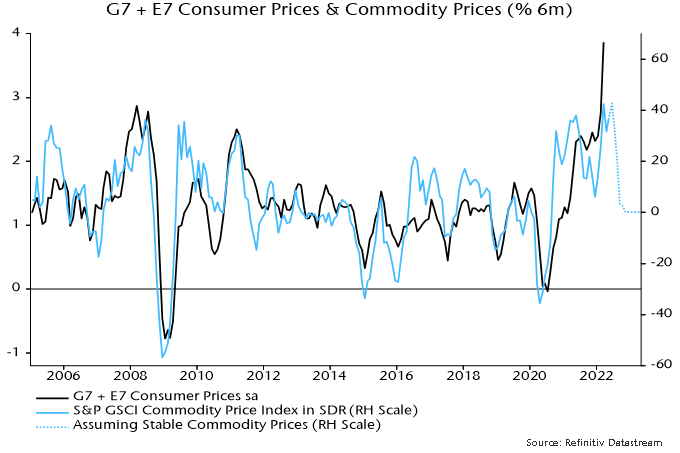
The historical relationship with commodity prices suggests that CPI momentum has overshot and will pull back, possibly sharply – chart 3.
Chart 3
Six-month industrial output momentum, meanwhile, may move back into contraction because of Chinese covid disruption and weakening trends elsewhere, reflected in soft April global manufacturing PMI results – chart 4.
Chart 4

Nominal money growth will probably weaken in response to rising rates and as central banks end / reverse QE but falls in CPI and industrial output momentum may dominate, resulting in a narrowing of the negative real money / output growth gap. The gap, indeed, could return to positive territory by mid-year – sooner than previously expected here.
This gap is a proxy measure of global “excess” money, which – on the monetarist view – is a key driver of demand for financial and real assets**.
Historically (i.e. from 1970-2021), global equities underperformed US dollar cash by 6.7% pa on average when the gap was negative, outperforming by 12.2% pa when it was positive. These numbers refer to month-ahead returns based on the most recent reading of the gap.
Equities underperformed cash on average when the gap was negative whether or not it was widening or narrowing. The average loss, indeed, was larger when the gap was narrowing. So the near-term message for equities remains unfavourable.
It is, however, a different story for bonds. Historically, Treasury returns have been sensitive not to the level of the gap but rather its rate of change. That is, a positive change in the gap has been associated, on average, with a fall in Treasury yields (and a negative change with a rise) – chart 5.
Chart 5

This year’s yield surge is “explained” by the move in the gap into deep negative territory.
Historically, the average fall in yields associated with a positive change in the gap was similar for positive and negative levels of the gap.
The prospective change of direction of the gap, therefore, suggests that the bond bear market is ending.
A reversal in yields would have implications for equity sectors / styles. Quality historically outperformed when excess money was negative but suffered this year from its correlation with yields – the magnitude of the yield rise may have weakened its usual defensive character. (Overweight consensus positioning may also have contributed to underperformance, i.e. quality had become momentum). A yield decline could allow a performance catch-up.
The MSCI World sector-neutral quality index has already reversed more than half of its earlier YTD underperformance despite further bond market weakness, with this recovery another indication that a yield top may be imminent – chart 6.
Chart 6

*G7 plus E7 aggregate. March estimate based on monetary data for all countries except Canada, Brazil and Korea (extrapolated).
**An additional proxy measure monitored here is the deviation of 12-month real narrow money growth from a long-term moving average. Historically, global equities outperformed cash on average only when both measures were positive. This second measure is expected to remain negative until late 2022, at least.
