
Entries from May 1, 2018 - May 31, 2018
Euroland money trends subdued before Italian crisis
 Simon Ward
 Post a Comment
Euroland monetary trends are signalling a further loss of economic momentum but – based on April data – do not suggest outright weakness. Italian political turmoil, of course, threatens to trigger capital flight and a general rise in risk aversion, developments that would probably be associated with additional monetary deterioration.
Softer economic expansion since the start of the year was predicted by a significant fall in six-month growth of real narrow and broad money during the second half of 2017. Last week’s flash purchasing managers’ surveys for May were again weaker than the consensus expected, providing further evidence that slower economic growth represents a change of trend rather than a temporary blip due one-off factors such as disruptive weather.
Six-month growth of real narrow money, as measured by non-financial M1 deflated by consumer prices, eased further in April, reaching its lowest level since 2013. Growth of the broader non-financial M3 measure was unchanged from its March level, which was the lowest since 2014 – see first chart.

Optimists point out that the purchasing managers’ indices remain at a level historically consistent with solid economic growth. The lagged relationship with real money growth, however, suggests that the surveys will weaken further – second chart.

Current monetary trends are still consistent with economic expansion. Six-month real non-financial M1 growth of 2.2% in April, or 4.4% annualised, is only modestly below its average over 2005-17, of 2.7% or 5.4% annualised. Real narrow money contracted before the 2008-09 and 2011-12 recessions – first chart.
Those recessions were also preceded by a divergence of monetary trends across countries. Six-month growth of real non-financial M1 deposits is currently similar in the “big four” economies – third chart. Growth in France and Spain, however, has fallen significantly since mid-2017 – the risk of negative data surprises may be greater in those two economies.

Italian real narrow money trends through April suggest that the economy was on course for continued moderate economic growth before the current political crisis. Recent developments may be contrasted with 2010-11, when monetary / economic weakness drove the rise in Italian government yield spreads, which contributed to a further deterioration in monetary trends – fourth chart. The source of the pressure is now political rather than monetary / economic, although negative feedback is again likely.

Is UK labour market resilience about to crumble?
Last week’s UK labour market report was superficially strong but cracks are appearing under the surface. A stalling of employment and a rise in unemployment would probably put the MPC’s rate-hiking plans on indefinite hold.
We are on the alert for a deterioration in labour market data in view of recent weak corporate money trends – six-month growth of real M1 holdings of private non-financial corporations (PNFCs) fell to zero in March. This may reflect downward pressure on profits and is likely to signal weaker prospects for business investment and hiring. Similar falls in real corporate money growth historically have usually been followed by a slowdown or outright fall in jobs – see first chart.

The labour force survey measure of employment continued to rise solidly in the latest three months and is up by 1.2% from a year ago. Total hours worked, however, increased by only 0.3% over the same period – second chart. Employment, that is, has been supported by a fall in average weekly hours, which may be an early sign of softening labour demand.

Consistent with this interpretation, the official vacancies series, based on a survey of employers, has fallen for three consecutive months, while online postings on reed.co.uk, the UK’s largest jobs board, remain below a peak reached in June / July 2017 – third chart.

The labour force grew by 0.8% over the last year, close to its average rate of increase since 2005, with a net exodus of foreign nationals offset by domestic population expansion and a further fall in inactivity. A decline in growth is likely as weaker labour demand curbs the outflow from inactivity but this may not fully offset a slowdown in jobs, implying an increase in unemployment.
While the labour force survey unemployment measure fell further in the latest three months, a rise in the claimant count gathered pace – fourth chart. The claimant count has been distorted by the roll-out of universal credit, which has resulted in some people who would not have claimed job-seekers’ allowance (JSA) under the previous system being required to search for work. The green line is an adjusted series based on the assumption that one in two of new universal credit claimants with a requirement to look for work would not have claimed JSA under previous arrangements. This assumption is arbitrary but does not seem unreasonable; the suggestion is that the claimant count would be rising under the old system.

Quarterly data on gross flows into and out of unemployment are consistent with the jobless rate being at or near a low. The fifth chart shows a “steady state” unemployment rate to which the actual rate would converge if inflow and outflow rates were to remain at their levels in the latest quarter, based on the method of Barnichon and Nekarda. The steady state rate sometimes leads the actual rate and may have bottomed in the third quarter of 2017.

Any rise in the unemployment rate would be a shock to the MPC, with the May Inflation Report forecasting a further fall from the current 4.2% to 4.0% in early 2019, based on market interest rate expectations.
Global money trends still downbeat
Global monetary trends weakened sharply in late 2017 / early 2018 and have yet to recover convincingly, arguing for maintaining a below-consensus forecast for economic growth.
Six-month growth of real narrow money in the G7 economies and seven large emerging economies peaked most recently in June 2017, falling to a nine-year low in February 2018 – see first chart. Based on the historical average nine-month lead time, this suggested that six-month industrial output growth would peak around March 2018, with a subsequent slowdown extending well into the second half. Output growth rose to a seven-year high in March but business surveys are signalling a loss of momentum – second chart.


Real narrow money growth recovered modestly in March but appears to have moved sideways in April, based on monetary data covering 60% of the G7 plus E7 aggregate – first chart. March / April growth was beneath the range between September 2008 and November 2017 and lower than industrial output expansion, a condition historically associated with below-average equity market returns.
Of the major economies, the US, China and Japan have released April monetary data, with Euroland and UK numbers due on 29 and 31 May respectively. US real narrow money growth fell back in April, offsetting rises in China and Japan – third chart.

The recovery in global real narrow money growth between February and April reflected a fall in six-month consumer price inflation, with nominal money expansion little changed – fourth chart. Commodity price trends had suggested that inflation would pull back but a further decline is unlikely unless oil prices weaken.

Previous posts discussed the possibility that global narrow money growth would rebound into mid-2018 in response to US tax cuts and easier Chinese monetary policy, a scenario that would imply better economic prospects for end-2018 / early 2019. US narrow money growth strengthened several months after previous large tax cuts were enacted – fifth chart. April monetary numbers were weak relative to this comparison but it is too early to dismiss the historical pattern.

A possible key difference, however, from these prior episodes is that the monetary base has been contracting, with weakness likely to be sustained by the Fed’s balance sheet reduction plan – sixth chart. Monetary policy, in other words, may be acting as a greater counterweight to fiscal stimulus on this occasion, offsetting the tendency for money growth to rise as tax cuts percolate through the economy.

As expected, Chinese monetary policy has shifted towards easing but this has yet to feed through to a significant rebound in money growth
A downbeat view of global economic prospects, therefore, will be maintained here pending a more convincing recovery in real narrow money expansion.
The monetary signal of slowing global economic momentum through late 2018 is supported by the OECD’s composite leading indicators, an update of which was released this week. Six- and one-month growth of a global trend-restored indicator based on the OECD data fell again in March – seventh chart.

Euroland "basic balance" deterioration suggesting weaker euro
Euro appreciation in 2017 was underpinned by a strengthening of the Euroland basic balance of payments position. The basic balance has deteriorated recently and credit / money trends suggest further weakness. Downside risk for the currency, therefore, has increased.
The “monetarist” approach to assessing currency prospects assumes that:
1) major currency swings are caused by changes in the basic balance, defined as the sum of the current account and net direct and portfolio capital flows; and
2) movements in the basic balance are caused by changes in the differential between the expansion of domestic bank credit and the growth rate of money and other domestic bank liabilities.
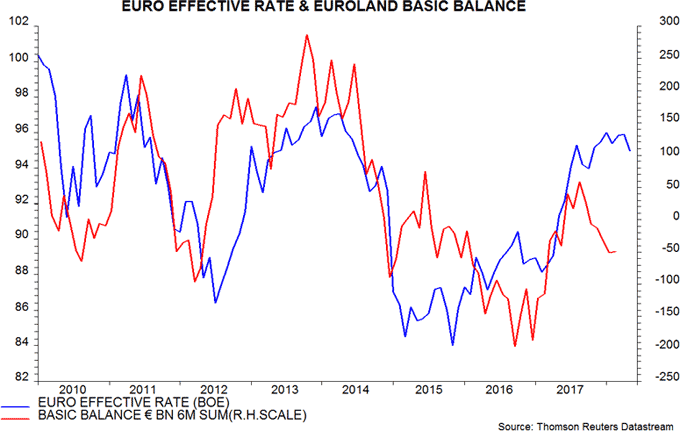
On 1), the first chart below shows the Bank of England’s euro effective exchange rate together with the Euroland basic balance, calculated on a six-month rolling basis. A positive relationship is apparent, with the basic balance sometimes leading currency swings. Euro strength in 2017 was associated with a turnaround in the basic balance from a large deficit into surplus. This improvement partially reversed in late 2017 / early 2018. The euro’s recent decline may reflect this reversal.
On 2), the basic balance mirrors – by accounting definition – changes in the net external assets of the banking system (including the monetary authority). This is because a basic balance surplus or deficit necessitates an offsetting flow of funds through the banks.
The change in banks’ net external assets, meanwhile, is equal to – again by accounting definition – the difference between their new domestic funding (i.e. money and other liabilities, including capital and reserves) and domestic credit expansion. A surplus of domestic funding relative to lending, for example, is reflected in a flow of funds overseas and a rise in net external assets.
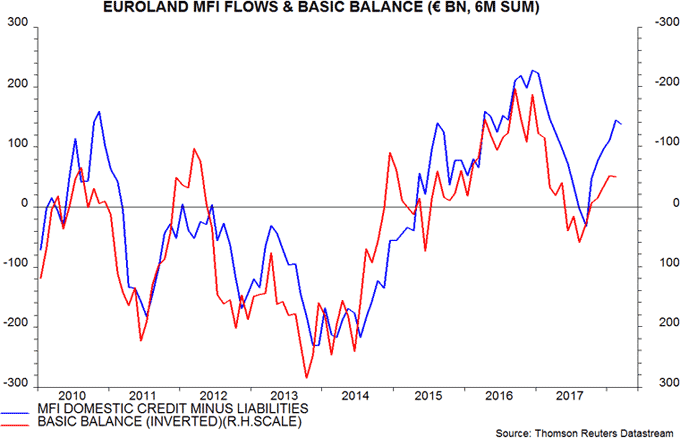
The second chart shows the gap between domestic credit and funding flows of “monetary financial institutions” (MFIs) and the basic balance, plotted inverted. The correspondence is not exact because the definitions of the series do not precisely correspond to theory and because of measurement error.
The monetarist approach assumes that this relationship is causal, i.e. changes in the balance between domestic credit and funding flows determine changes in the basic balance, which in turn drive currency movements.
The monetarist approach was the basis for a suggestion here in January 2017 that the euro (as well as the yen and renminbi) would rise against the US dollar in 2017. The thinking was that the ECB’s wind-down of QE would curb domestic credit expansion, while stronger economic growth would boost the demand to hold money and other bank liabilities. A narrowing of the gap between domestic credit expansion and domestic funding growth would strengthen the basic balance and boost the euro.
This scenario played out, with six-month rates of increase of domestic credit and domestic liabilities converging in August / September 2017 – third chart.
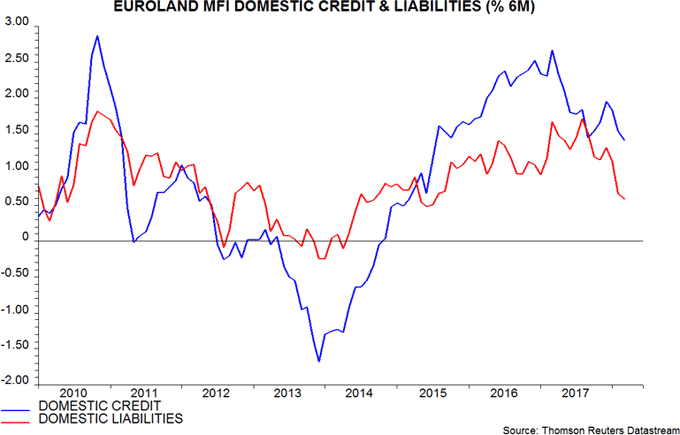
A follow-up post in December, however, suggested that the balance between domestic credit and funding flows would turn negative for the euro in 2018, reflecting the ECB’s tardiness in normalising monetary policy. The slow pace of QE wind-down coupled with a likely firming of private lending growth would limit a further decline in domestic credit expansion, while the refusal to adjust policy rates to reflect a stronger economy and 1-2% inflation was likely to depress demand for bank liabilities.
Recent trends are consistent with this forecast, with growth of domestic liabilities falling with credit expansion little changed, and the basic balance moving back into deficit. The assessment of the December post still appears valid, with a possibility that the ECB will delay ending QE and push back a rate rise even further in response to recent softer activity data, a fall in core consumer price inflation and renewed concern about Italian political and economic instability.
The monetarist approach, by contrast, suggests a positive outlook for the US dollar, with the Fed’s QE reversal plans implying an increasing drag on domestic credit expansion and money demand likely to be boosted by rising interest rates.
UK monetary trends: weakness extends
Before Bank of England Governor Mark Carney’s latest handbrake turn, the expectation here was that the MPC would raise interest rates again in May, based on prior “guidance” and strong labour market data. Such a move, however, was viewed as dangerous against a backdrop of weakening monetary trends.
The change of signal from Governor Carney, of course, had nothing to do with monetary concerns. It seems, instead, to have been part of a loosely coordinated shift in favour of slower policy “normalisation” by major central banks, excluding the Fed, probably motivated by a combination of US dollar weakness and softer economic data. The Bank of Canada also pushed back against early rate hike expectations, while last week’s ECB and BoJ communications were dovish.
The MPC shift has slightly reduced downside economic risks but March monetary data released today continue to suggest deteriorating prospects.
The forecasting approach here emphasises the narrow non-financial M1 measure, comprising cash and sterling sight deposits of households and private non-financial corporations (PNFCs). Annual growth of this measure fell further to 4.4% in March, the lowest since 2012, while the rate of increase in the latest three months was just 1.6% – see first chart.

Broad money trends are also weak. Annual growth of non-financial M4 – which includes household / PNFC holdings of sterling time deposits, cash ISAs, short-term bank securities and repos – declined to 3.4% in March, with a 2.4% rate of increase in the latest three months. The comparable figures for the Bank of England’s M4ex broad measure were 3.8% and 1.2% respectively. M4ex includes financial-sector money holdings but these are volatile and contain little information about near-term economic prospects.
The second chart shows the two-quarter change in GDP and six-month changes in real non-financial M1 and non-financial M4, i.e. deflated by consumer prices (seasonally adjusted). The recent decline in inflation has supported real money trends but the six-month changes remain close to zero, suggesting very weak economic prospects.

The slowdown in real non-financial M1 was initially driven mainly by the household component but the six-month change in corporate (PNFC) real M1 fell to zero in March – third chart. This is significant because the corporate component individually has been a reliable leading indicator of GDP trends – it turned down well in advance of the 2008-09 recession – and current weakness may indicate that business are cutting back investment and expansion plans.

In a recent speech, the MPC’s Michael Saunders downplayed concern about weaker broad money growth, arguing that households’ demand for money has been depressed by a portfolio shift into mutual funds. Without presenting data, Mr Saunders suggested that, adjusting for this shift, broad money growth was similar to the last few years.
The fourth chart compares annual growth of non-financial M1, non-financial M4 and a broader measure incorporating national savings, foreign currency deposits and retail flows into UK-registered unit trusts and OEICs (“non-financial M4++”). Growth of this latter measure is, indeed, around its average in recent years.

Mr Saunders’ view that this resilience offers reassurance about economic prospects is not shared here, however, for several reasons.
Mutual fund holdings are not money. A portfolio shift out of money into funds indicates a reduced likelihood of near-term spending. Focusing on an all-encompassing aggregate, therefore, risks throwing away important information about economic prospects.
Consistent with this, the broader measure has underperformed non-financial M1 and non-financial M4 as a forecasting indicator in recent years. Annual growth of nominal GDP rose over 2012-14, fell in 2014-15, moved up again in 2015-16 before declining recently. Each of these swings was clearly signalled in advance by the conventional money measures. Growth of the broader aggregate, by contrast, showed little variation. In particular, it failed to predict the recent significant nominal GDP slowdown.
While annual growth of the broader aggregate remains respectable, its six-month change is now weakening. Together with the rise in consumer price inflation since early 2016, this has resulted in a meaningful fall in six-month real growth – fifth chart*. The broader financial aggregate, that is, is belatedly confirming the slowdown signal from conventional money measures.

*Latest = February; mutual fund flow data for March have yet to be released.
