
Entries from March 1, 2022 - March 31, 2022
US money trends at odds with hawkish Fed
 Simon Ward
 1 Comment
US broad money growth has normalised even as the numbers remain inflated by the tail end of the Fed’s QE programme.
The broad money measure calculated here – “M2+”, which adds large time deposits at commercial banks and money fund balances to the official M2 measure – rose at an annualised rate of 5.4% in the three months to February, only slightly higher than a 4.5% average over 2015-19, when the Fed’s core inflation measure was mostly below the 2% target.
Chart 1

The Fed’s securities holdings rose by the equivalent of 3.8 pp of M2+ expressed at an annualised rate in the three months to February.
Current Fed signals suggest a mid-year start to QT. Broad money momentum could fall to a weak level in H2 unless bank lending grows strongly.
Commercial bank loan expansion was rapid in late 2021, partly reflecting high stockbuilding, but cooled in January / February, while demand for home loans could plunge in response to the recent surge in mortgage rates.
The monetary slowdown, as usual, will feed through to inflation with a “long and variable” lag but a reasonable expectation – assuming that current (or lower) growth is sustained – is that core price momentum would return to target during H2 2023.
The slowdown supports the message from the Wu-Xia shadow fed funds rate that there has already been a significant effective policy tightening via the withdrawal of “unconventional” support measures (QE, forward guidance, etc). The shadow rate uses information from the term structure of interest rates to quantify the impact of such measures when the policy rate is at the lower bound. The suggestion is that last week’s quarter-point hike was the ninth not first such move in the Fed’s tightening sequence – chart 2. (This casts doubt on market prognoses based on examining behaviour after previous first Fed hikes.)
Chart 2

The current conjuncture has some similarity to early 2016. The shadow rate had risen significantly during 2015 as the Fed wound down QE before its first hike in December. Subsequent US / global economic weakness caused policy-makers to defer the next hike for 12 months (i.e. until December 2016).
There are two key differences. The obvious one is inflation – core was below target during 2015-16, giving the Fed scope to execute a “dovish pivot” as economic news and markets weakened. In addition, the global stockbuilding cycle was nearing a low when the Fed hiked in December 2015. The current assessment here is that it is beginning a downswing, with a trough unlikely to be reached until 2023. Central banks lag the cycle and typically remain hawkish until well into the downswing (thereby magnifying the cycle).
Both considerations suggest a more sustained Fed tightening campaign – albeit increasingly questionable from a “monetarist” perspective – with a correspondingly much higher risk of a recessionary outcome than in 2016.
Has the Chinese economy bottomed?
The Chinese economy regained some momentum around year-end, as had been suggested by a turnaround in six-month real money growth in mid-2021. Monetary trends remain moderately hopeful but the recovery faces challenges from covid disruption, slowing global demand and ongoing property sector weakness.
Most official economic data are presented as year-on-year growth rates. Chart 1 shows estimates of seasonally adjusted levels for key series derived from the year-on-year numbers. Industrial output rose strongly between October and January / February, more than reversing weakness earlier in 2021. From the demand side, exports and government investment appear to have been key drivers, possibly supplemented by stockbuilding. Retail sales and private investment rose slightly in value terms, while home sales recovered following a precipitous drop.
Chart 1
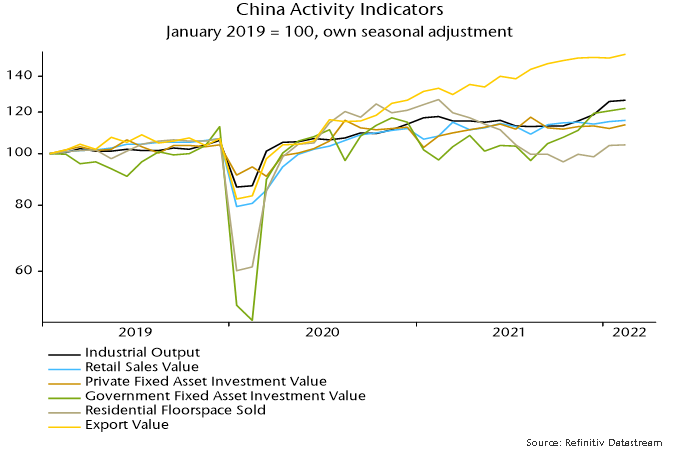
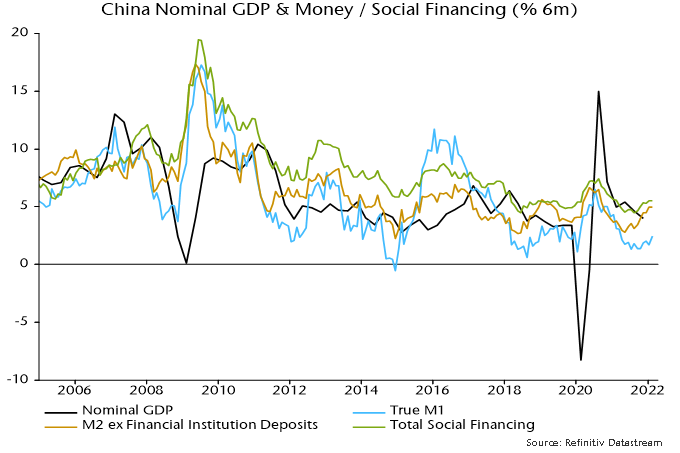
Six-month growth rates of money and credit bottomed over May-July 2021 but a strong rebound in broad money expansion during H2 wasn’t matched by narrow money, tempering optimism here about a likely economic reacceleration. Narrow money growth firmed in February but a further rise is necessary to warrant a positive view – chart 2.
Chart 2
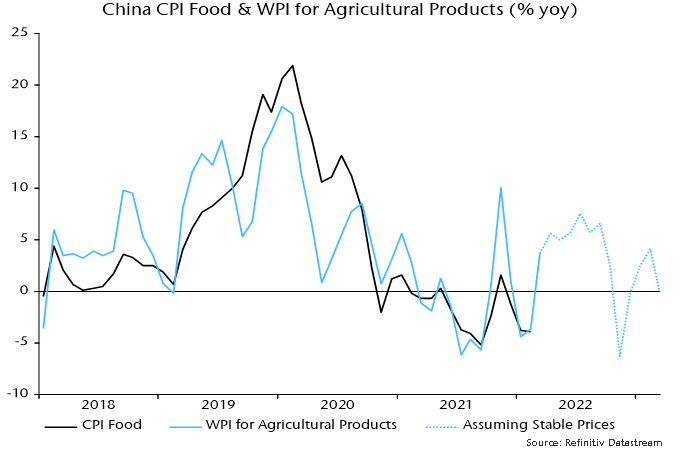
The money growth recovery has been larger in real terms because of a slowdown in six-month consumer price momentum since mid-2021, with higher energy costs more than offset by weakness in food prices – chart 3. This tailwind may be about to reverse, with wholesale price data suggesting a rebound in food inflation – chart 4.
Chart 3
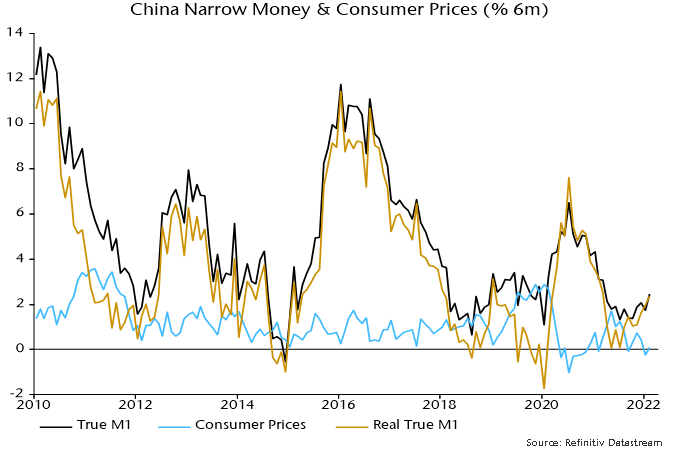
Chart 4
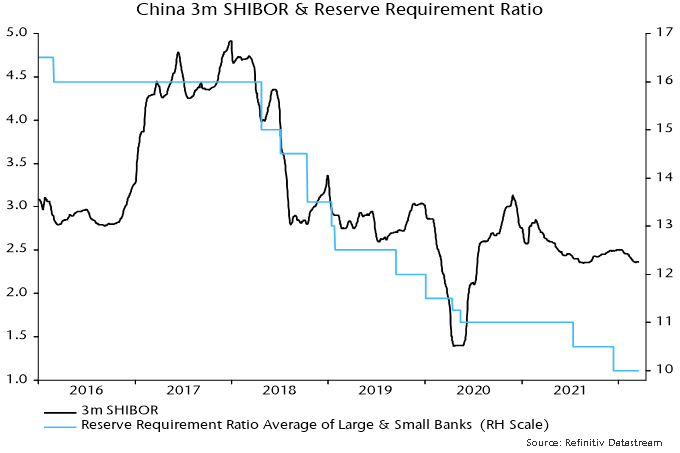
The Evergrande crisis threatened to tighten financial conditions and abort the money growth recovery. Three-month SHIBOR firmed in late 2021 but retraced the move in January / February, stabilising recently – chart 5. A further fall would be welcome confirmation that the PBoC remains on an easing tack, supporting hopes of further monetary improvement.
Chart 5
Inflation lessons from the 1970s
Why did high inflation become entrenched in the 1970s?
The consensus view is that an initial inflation shock became embedded in expectations, resulting in inflationary price- and wage-setting behaviour.
The “monetarist” view is that the underlying driver was sustained high money growth, which played a key role in allowing inflation expectations to become dislodged.
A surge in G7 annual broad money growth to a peak in November 1972 was followed by a surge in annual CPI inflation to a peak two years later – see chart 1.
Chart 1
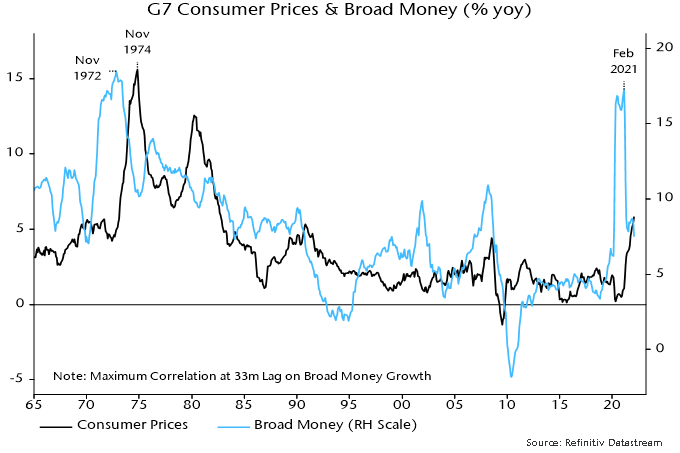
Broad money growth showed a similar surge to an initial peak in June 2020 and CPI inflation may top out in mid-2022. The ultimate peak in money growth was in February 2021, suggesting that inflation will remain high into 2023.
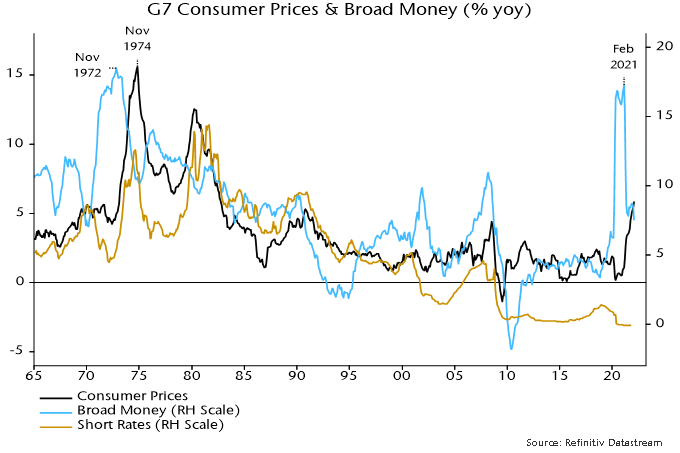
Monetary authorities responded to the 1973-74 inflation surge by tightening policy aggressively – see chart 2, which overlays a weighted average of G7 short-term interest rates. They had ignored the inflationary warning from money trends but displayed Volcker-esque zeal in attempting to correct their mistake.
Chart 2
Policy tightening resulted in a major monetary slowdown over 1973-75. With inflation continuing to surge, real money balances plunged and economies moved into recession.
The critical policy error occurred at this point. While money growth had fallen significantly, it remained high by historical standards and inconsistent with a full reversal of the inflation rise. Yet policy-makers performed another U-turn as recession unfolded, cutting interest rates as aggressively as they had raised them.
The result was that G7 broad money growth bottomed out above 10% in early 1975 and rebounded into 1976. Short rates were held at their lower level despite persistent high inflation and money growth remained above 10% until 1979.
What are the lessons for today?
While rate rises are only beginning, the view here is that there has already been a major “tightening” of policy in the form of the cessation of QE and shift to hawkish forward guidance. In the US, this is captured by a 210 bp rise in the Wu-Xia shadow fed funds rate between November and February. (The corresponding UK shadow rate has risen by an astonishing 10.2 pp since January 2021).
Consistent with this interpretation, annual broad money growth fell to an estimated 7.5% in February, with the three-month annualised rate of increase down to 5%.
With CPI momentum still rising, real money balances are now contracting and recession risk has risen. The real money squeeze, however, is mild compared with 1974-75.
On current trends, the monetary backdrop will soon be compatible with an eventual return of inflation to targets, although possibly not until 2024.
Central banks face opposing risks. If they raise rates in line with expectations, monetary trends could weaken further, causing unnecessary economic damage and a medium-term undershoot of inflation targets.
If they back off, however, money growth could stage a 1975-style rebound at a time when inflationary expectations are showing signs of becoming “unanchored”.
The judgment here is that the former risk is much greater.
A key point is that high money growth in the 1970s reflected underlying strength in private sector credit demand. The 1974-75 rate cuts, therefore, resulted in a big rebound in bank lending expansion, which underpinned inflationary money growth – chart 3.
Chart 3
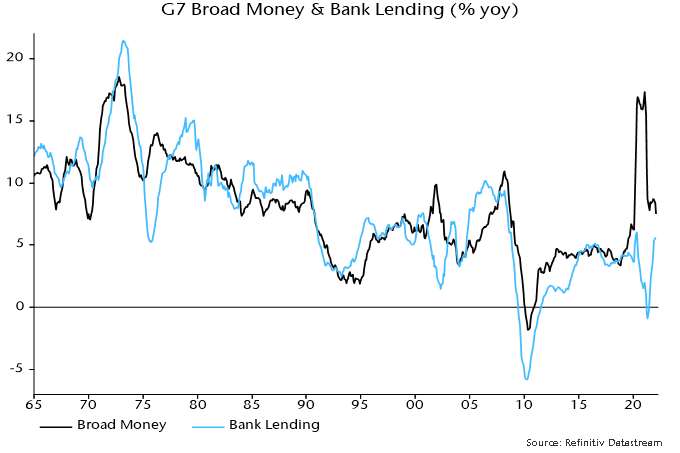
The 2020 surge in money growth, by contrast, was entirely due to QE (more precisely, monetary financing of fiscal deficits). Bank lending expansion has risen recently but is nowhere near the levels reached in the 1970s, or even the noughties.
The upshot is that money growth is unlikely to rebound strongly if central banks back off from rate rises – assuming no return to QE.
Policy-makers should monitor monetary trends and adjust their stance accordingly – in a dovish direction if the recent slowdown extends or hawkishly in the unlikely event of a reacceleration. Astonishingly, they continue to deny any linkage between the 2020 money growth surge and current inflation problems. Such denial is a recipe for more bad decision-making and 1970s-style economic volatility.
Fantasy forecasting and the ECB
The ECB under former President Jean-Claude Trichet twice raised interest rates into oncoming recessions (in 2008 and 2011). The current ECB hasn’t raised rates yet but is scaling back QE much faster than was expected late last year.
The six-month rate of change of Eurozone real narrow money had turned negative before the 2008 / 2011 rate rises and subsequent recessions. It is about to do so again now.
In an eerie replay, M. Trichet yesterday gave an interview in which he opined that the Eurozone was “far from recession territory”.
The current ECB seems equally complacent. The staff forecast for GDP growth in 2022 was yesterday lowered from 4.2% to 3.7% but still incorporates quarterly increases of 1.0% in Q2 and Q3, i.e. a combined 2.0% or 4% annualised.
The “best” monetary leading indicator of Eurozone GDP, according to the ECB’s own research, is real non-financial M1, i.e. holdings of currency and overnight deposits by households and non-financial corporations deflated by consumer prices.
The six-month change in real non-financial M1 fell to zero in January and is likely to have been negative in February, based on a further increase in six-month consumer price momentum – see chart 1.
Chart 1
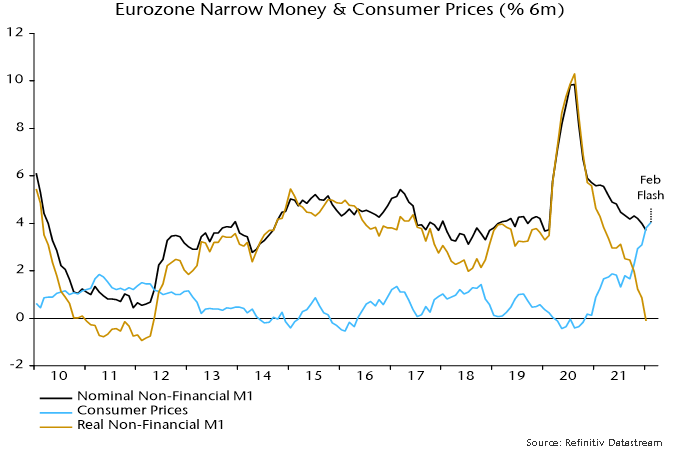
The six-month real narrow money change was negative in 18% of months between 1970 and 2019. The average change in GDP in the subsequent two quarters combined was zero. The average since the inception of the euro in 1999 was -0.8%.
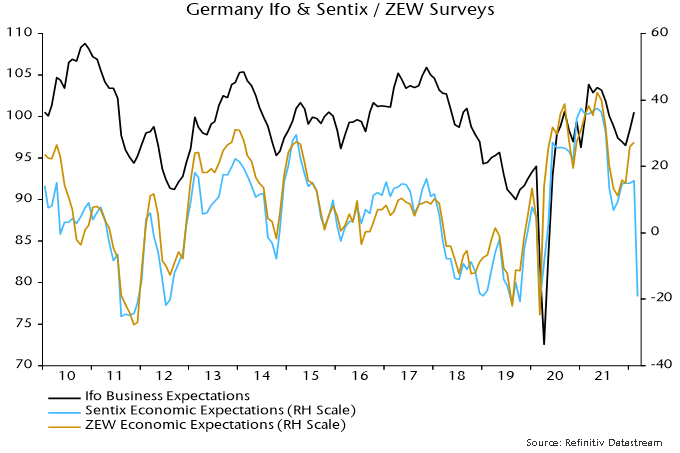
Business surveys could be about to crater: the March Sentix survey of financial analysts is ominous – chart 2. The ECB and consensus may portray weakness as a kneejerk response to Russia’s invasion of Ukraine, drawing a parallel with past geopolitical events that had little lasting economic impact. Monetary trends suggest that a slowdown to stall speed was already in prospect and the Ukraine shock may tip the economy over into recession.
Chart 2
The ECB is in a policy bind of its own making. The view here is that it is too late to tighten and policy-makers should ride out the current inflation storm. The worry is that inflation expectations will become “unanchored”. Fake hawkish rhetoric backed by fantasy GDP forecasts may be their attempted escape route.
Global real money squeeze approaching recession threshold
Global real money trends were signalling economic weakness before Russia’s invasion of Ukraine. The consequent spike in commodity prices threatens a recession warning signal.
Global six-month real narrow money growth – the key monetary leading indicator followed here – turned negative before the six global recessions preceding the covid shock – see chart 1. The covid recession was not a genuine cyclical contraction because it was caused by a government shutdown of economic activity rather than endogenous spending weakness.
Chart 1

With most data now in, six-month real narrow money growth was an estimated 1.4% (not annualised) in January. This decomposes into nominal money growth of 3.8% and six-month consumer price momentum of 2.3% - chart 2.
Chart 2

CPI momentum seemed likely to moderate before the invasion, based on a slowdown in the six-month change in commodity prices into December – chart 3. The latest spike suggests renewed upward pressure. A reasonable expectation is that the six-month CPI change will match the 2008 peak of 2.9% if commodity prices remain at current levels.
Chart 3

The global inflation measure, however, will receive an additional boost from a surge in Russian consumer prices due to the rouble’s collapse. Russian six-month CPI momentum was 4.9% (again, not annualised) in January but could rise to 15-20% – chart 4. Admittedly, a larger rouble fall in 2014-15 was associated with a lower six-month inflation peak of 11.3% but the depreciation then was driven by oil price weakness, which had an offsetting effect. Russian energy prices could decline as international buyers switch to other suppliers leading to a domestic glut, but any fall is unlikely to be as large as in 2014-15, while sanctions and consequent shortages may put upward pressure on other items.
Chart 4

Russia has a 4% weight in the G7 plus E7 measures calculated here so a 10-15 pp rise in six-month CPI momentum from the current level would push up global CPI momentum by 0.4-0.6 pp.
The combined effect of the commodity price spike and rouble collapse, therefore, could be to boost global six-month CPI momentum by 1 pp or more. A slowdown in six-month nominal money growth of 0.5 pp would then be sufficient for real money growth to turn negative. A slowdown of this magnitude, or greater, is plausible on the basis of QE tapering and rate rises to date, without factoring in widely expected (but unwise) future policy tightening.
A further rise in global six-month CPI momentum – if the above scenario proves correct – may take several months to play out so a recession warning from real money might not be received until well into Q2.
