Entries from March 1, 2019 - March 31, 2019
Euroland money update: surprising strength
Euroland economic weakness was signalled by a monetary slowdown in late 2017 / early 2018. Money growth rates stabilised in mid-2018, while more recent data have shown an improvement, particularly in real terms. Current trends may be contrasted with 2008 and 2011, when unwise ECB policy tightening resulted in real money contraction and subsequent recessions. The suggestion is that economic momentum will stabilise during the first half of 2019 and recover later in the year, barring negative external developments. External risks, however, are high, with possible adverse scenarios including an inventory-led US recession, further Chinese economic weakness, a US / EU trade war and an early no deal Brexit.
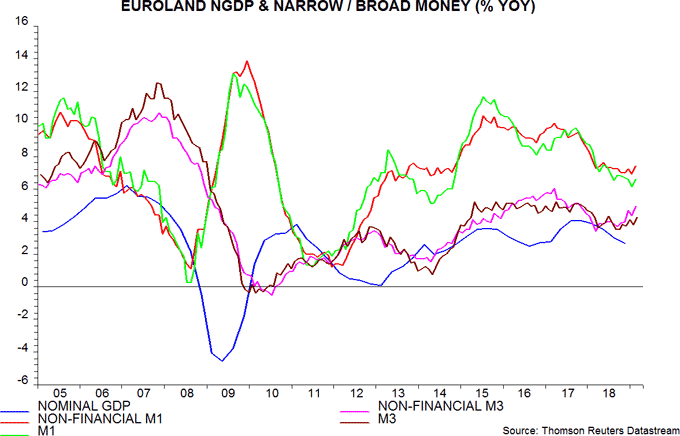
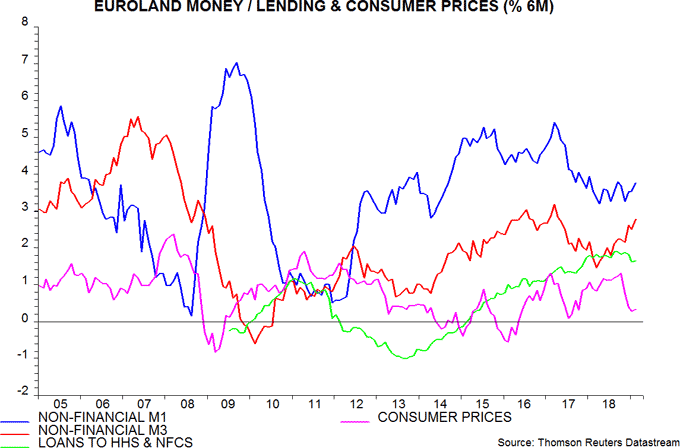
Annual growth rates of the headline M1 and M3 measures rose to 6.6% and 4.3% respectively in February, the latter representing an eight-month high. It has been claimed that headline money growth has been artificially inflated by “double-counting” of deposits of certain financial institutions. The basis for this claim is unclear. The focus here is on “non-financial” M1 and M3, excluding deposits of all financial institutions, on the grounds that movements in such deposits are unlikely to provide information about near-term prospects for spending on goods and services. Annual growth of the two measures rose to 7.4% and 4.9% in February, higher than for the headline aggregates – see first chart.
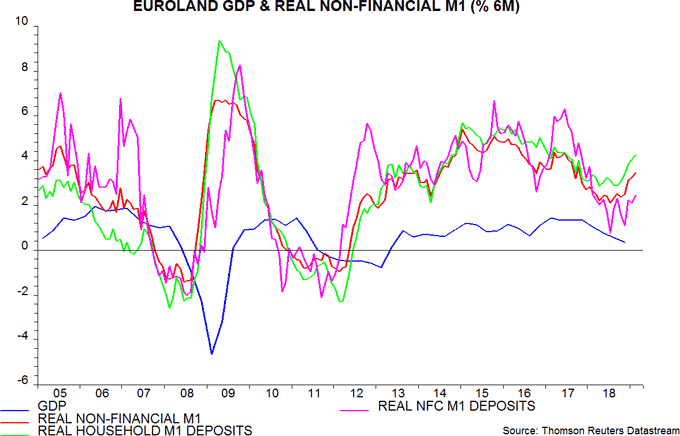
The second chart shows six-month growth rates of the four measures deflated by consumer prices. There has been a significant upswing since mid-2018 in all four cases, suggesting that economic momentum will begin to revive from the second quarter of 2019, allowing for a typical nine-month lead.
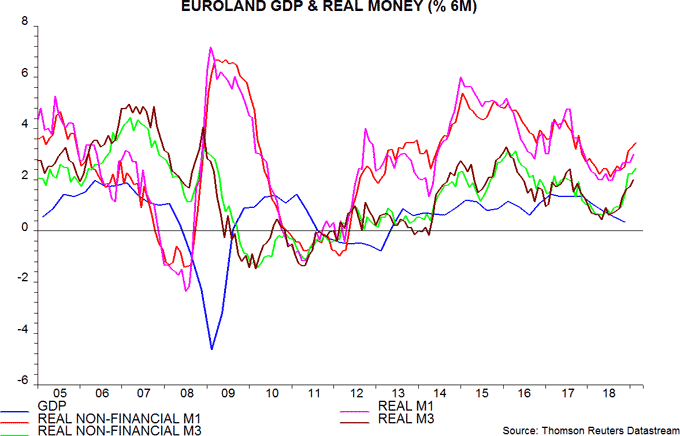
Six-month real money growth, admittedly, has been boosted by an energy-driven fall in inflation, which is now starting to reverse. Nominal growth rates, however, have also firmed, particularly for broad money – third chart. The counterparts analysis of M3 indicates that the negative impact of ending QE has been offset by a strengthening "basic" balance of payments position, reflecting a slowdown in portfolio capital outflows. This supports the long-held view here that QE "leaks" abroad and has disappointingly small domestic monetary effects.
Real narrow money growth of both households and non-financial corporations (NFCs) has recovered – fourth chart.
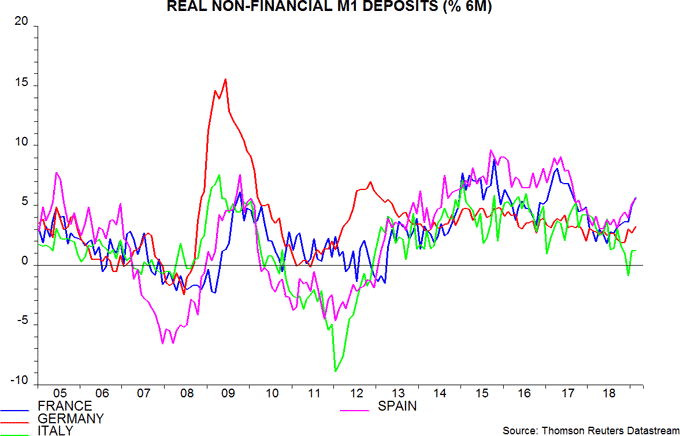
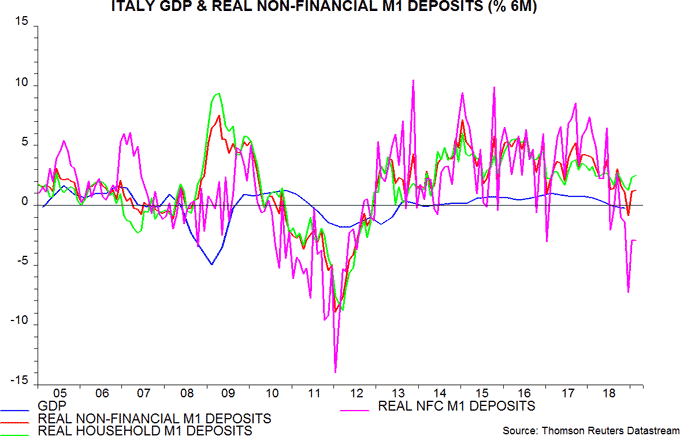
Money trends diverged significantly across the major Euroland economies in the run-up to the 2008-09 and 2011-12 recessions. Italian real money growth is lagging but a similar gap has yet to open up – fifth chart. Italian corporate narrow money, however, is contracting, suggesting further economic weakness – sixth chart. This negative signal contrasts with solid money trends, both household and corporate, in France and Spain.
Why isn't the UK MPC easing?
The MPC last week left policy unchanged but the judgement here is that incoming news warrants a reversal of August’s quarter-point rate hike. Monetary trends are worryingly weak, the global economy continues to slow and business confidence has fallen to a level historically associated with policy easing.
On the latter point, the CBI yesterday released its first-quarter financial services survey, which echoed earlier industrial and business / consumer services surveys in reporting a plunge in optimism. The distributive trades survey, surprisingly, is still showing some resilience but it has often lagged the other sectors historically – see first chart.

The second chart shows a simple average of the optimism balances across the four surveys, along with Bank rate. At -28, the average is the weakest since the 2008-09 recession and similar to the level reached in 1998, during the Russian / LTCM financial crisis. The MPC has always eased policy when the average has fallen to -8 or below. (In 2011, easing took the form of additional QE rather than a Bank rate cut.)

The MPC is reluctant to admit that the August hike was a mistake and is using Brexit turmoil as an excuse to hold fire. This risks allowing a negative confidence / spending spiral to develop, requiring more substantial policy action later. The proximity of rates to the effective lower bound strengthens the case for the MPC to act pre-emptively. A rate cut could be reversed swiftly in the unlikely event of a smooth Brexit and subsequent economic bounce.
Five reasons for fading UK labour market strength
1. Employment is a lagging indicator – strength in late 2018 may reflect a pick-up in quarterly GDP expansion to 0.6% in the third quarter. Growth fell back to 0.2% last quarter.
2. Business surveys are signalling slower hiring – see first chart, which shows an average of employment expectations across the CBI / EU Commission monthly services, industry and retailing surveys.

3. As well as building inventories of physical goods, firms may be “stockpiling” labour to protect against an early end to freedom of movement in the event of a no deal Brexit. This could partly explain continued dismal productivity performance.
4. Solid increases in employment and average earnings have pushed annual growth of aggregate wages up to 5.1%, well above nominal GDP expansion of 3.0% – second chart. The excess implies a further squeeze on profits, with negative feedback to future investment and hiring.

5. Weak corporate real narrow money growth corroborates a squeeze on finances and is a negative signal for future employment – third chart.

Global money update: is the mini-recovery ending?
Global six-month real narrow money growth is estimated to have edged up further in February but a likely rebound in inflation through mid-year could reverse the recent recovery. Such a scenario would suggest an extension of global economic weakness into early 2020.
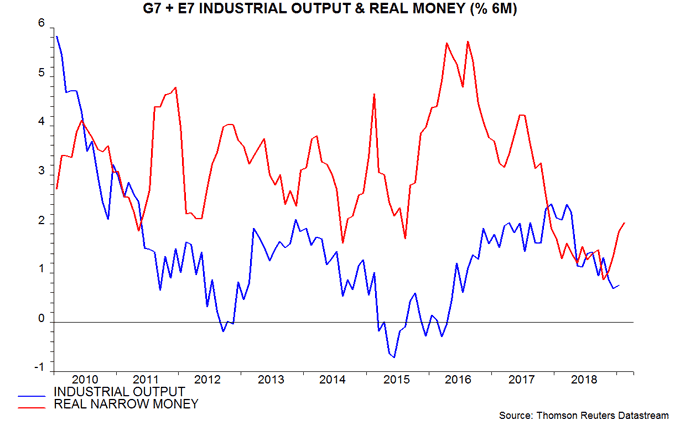
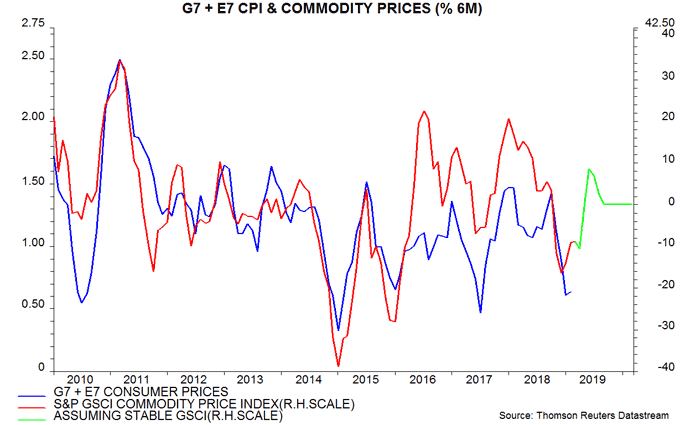
February monetary numbers have been released for the US, China, Japan, Brazil and India, together accounting for two-thirds of the G7 plus E7 aggregate tracked here. Assuming unchanged nominal money trends elsewhere, and taking into account February inflation data for 12 of the 14 countries, six-month growth of real narrow money is estimated to have risen to 2.0% (not annualised) from 1.8% in January – see first chart.
The 2.0% estimate compares with a low of 0.9% in October 2018 but is weak by post-crisis standards – growth was at this level or lower in only three months between October 2008 and November 2017. The judgement here remains that a rise to at least 3% is needed to suggest a significant recovery in economic momentum.
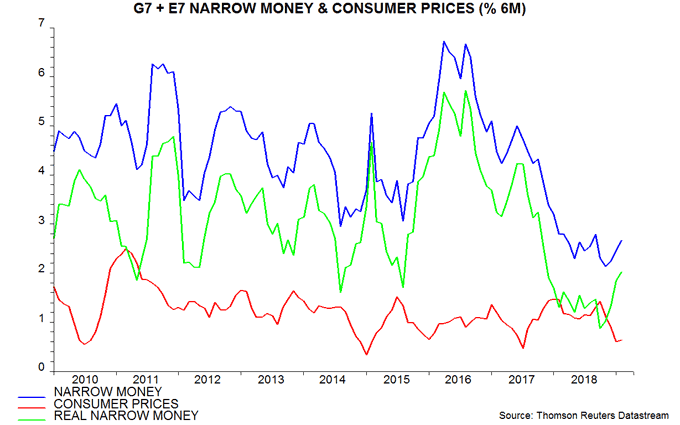
The second chart shows that nominal money growth increased in February but is only 0.5 percentage points (pp) above its recent low. The pick-up in real money growth since October mainly reflects a 0.8 pp decline in six-month consumer price inflation.
Inflation, however, stabilised in February and is likely to climb sharply into mid-year as the recent recovery in oil prices feeds through – third chart. The six-month rate could rise by 0.5pp, in which case real money growth would fall back to 1.5% if nominal expansion were to remain at its current level. This would be unchanged from a year ago (i.e. in June 2018), suggesting no exit from global economic weakness before early 2020.
Will nominal money trends pick up to offset the inflation rebound? While policy-makers have scrapped tightening plans, they have yet to embrace easing – except in China. The Fed may confirm tomorrow that QT will continue at least through mid-year. As discussed last week, Chinese money and credit trends have yet to respond to policy easing, possibly reflecting damage to the “transmission mechanism” from the clampdown on shadow banking.
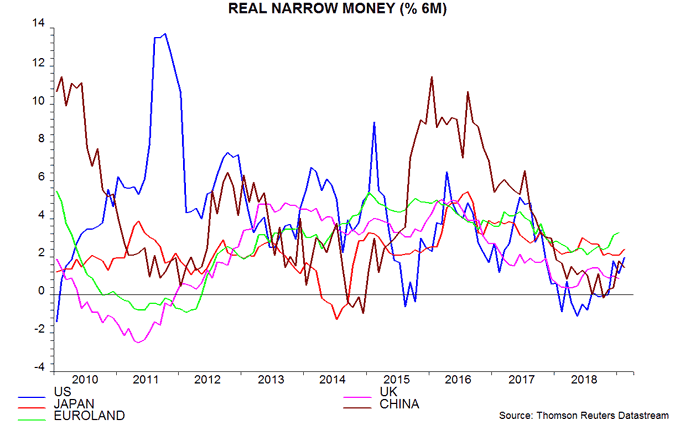
The fourth chart shows real narrow money growth in the major economies – note that the latest data points for Euroland and the UK are for January not February. Euroland relative strength is consistent with a recent improvement in economic news compared with elsewhere – the Citi Euroland surprise index has crossed above a weakening US index.
The recovery in Chinese real money growth has been inflation-driven and rising energy / food prices may reverse this effect over coming months. The US rebound reflects firmer nominal trends as well as lower inflation but the former may prove temporary if QT continues into the second half.
Chinese money update: no reflation signal
Chinese money and credit trends remain weak, casting doubt on claims that policy stimulus is gaining traction and will lead to a significant recovery in economic momentum later in 2019.
Economic data for January / February signal a further decline in year-on-year nominal GDP growth in the first quarter– see first chart. Additional weakness had been expected given a continued softening of narrow money and credit trends through 2018.
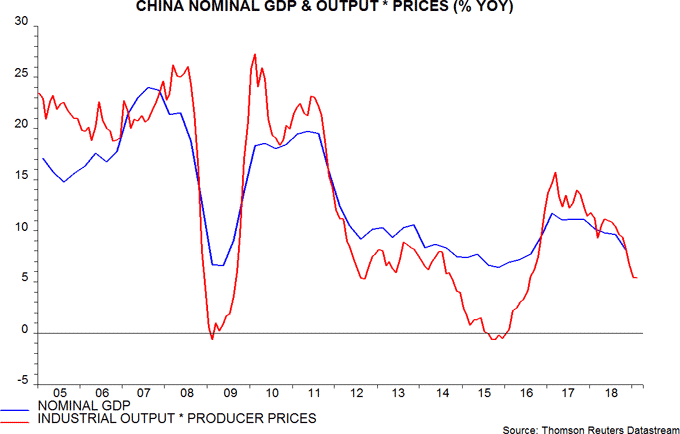
A strong monthly flow of broad credit – “total social financing” (TSF) – in January was trumpeted by optimists as signalling a turning point. Such an interpretation was hazardous given the volatility of the monthly data and a likely positive New Year timing effect. The February number, unsurprisingly, slumped.
The optimists argue that the combined January / February flow was still 25% higher than a year before but this creates a misleading impression. Expressed as a percentage of the stock, the January / February increase was 2.5%, which – although up from 2.2% last year – was lower than January / February growth in each year from 2013 through 2017.
Year-on-year TSF growth fell back from 10.4% in January to 10.1% in February, barely higher than December’s 9.8% record low – second chart.
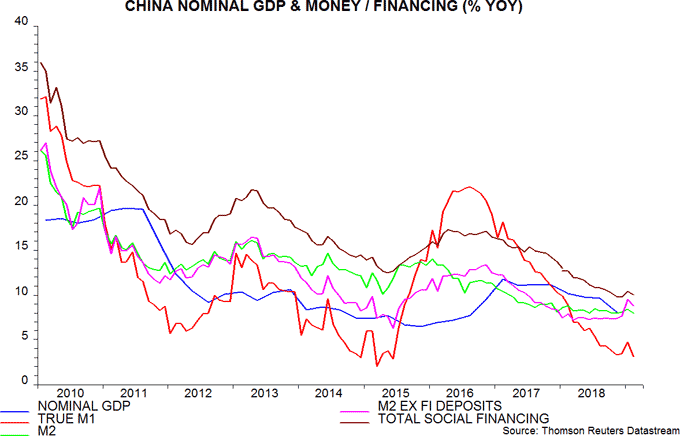
The forecasting approach here focuses on narrow money rather than credit but recent trends are equally discouraging. After a small rally in December / January, year-on-year growth of true M1 – which adds household demand deposits to the official M1 measure – declined to a new 44-month low in February.
Broad money trends are somewhat difficult to interpret. Year-on-year M2 growth fell back to its recent low of 8.0% in February. A contraction of bank deposits of non-bank financial institutions, however, has exerted a major drag on the aggregate in recent months, i.e. M2 growth excluding such deposits has picked up. The judgement here is that these trends reflect the clampdown on shadow banking and a consequent shift of business onto banks’ balance sheets. The rise in M2 growth of households and non-financial enterprises / government organisations may have been offset by a reduction (unrecorded) in holdings of shadow system liabilities, such as wealth management products. The shadow system contraction may also explain the fall in deposits of non-bank financial institutions. If this interpretation is correct, aggregate M2 may currently be the better measure to use for assessing economic prospects.
Shorter-term trends in the money / credit aggregates give a similarly downbeat message to year-on-year growth rates. Six-month growth of true M1 remains range-bound at a low level, while that of TSF has slipped back – third chart.
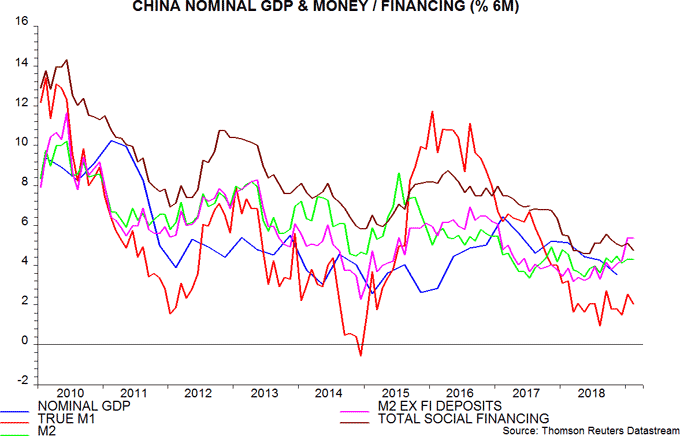
Six-month real growth rates have been boosted by a recent energy-driven fall in consumer price inflation but this is likely to unwind into mid-year.
OECD leading indicators still weakening
The OECD’s composite leading indicators support the expectation here of a further loss of global economic momentum into mid-2019.
The OECD’s indicators provide an independent, though less timely, cross-check of signals from monetary trends. With rare exceptions (e.g. Canada, India), the country indicators do not contain a monetary component. They tend to be dominated by business and consumer survey information, though also include financial indicators such as equity prices and the yield curve.
As previewed in a post last week, the G7 composite indicator registered another significant monthly fall in January, suggesting that GDP expansion will remain well below trend over coming months – see first chart.
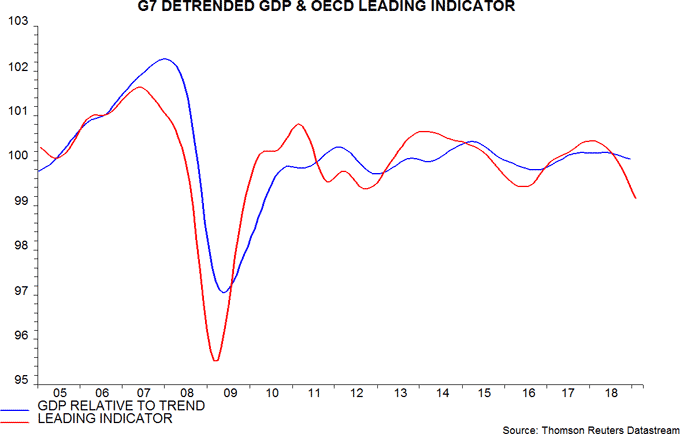
The OECD’s practice of presenting its indicators in trend-adjusted form obscures important information about their internal momentum. An alternative approach followed here involves:
- Combining country indicators for the G7 and emerging E7 to create a “global” trend-adjusted measure.
- Combining this measure with an estimate of the trend in G7 plus E7 industrial output to form an indicator of the level of output.
- Using turning points in the rate of change of this indicator to anticipate turning points in industrial output momentum.
Historically, turning points in the six-month change in the indicator have led turning points in six-month output momentum by four to five months on average – second chart.
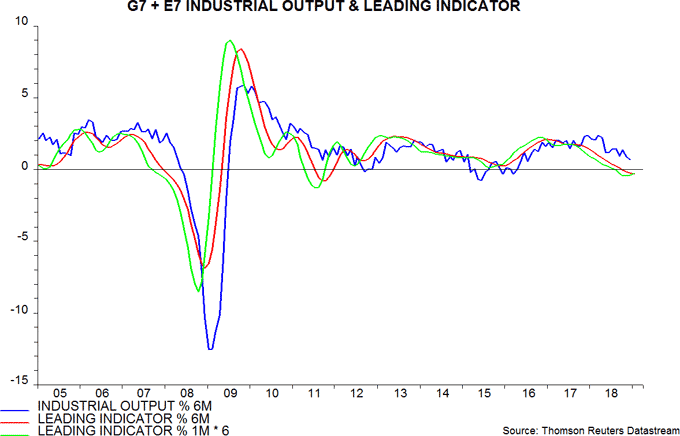
The central view here, based on monetary trends, is that global six-month industrial output momentum will bottom around July 2019. Such a scenario would suggest a low in the six-month change of the leading indicator in February or March.
Consistent with this scenario, the six-month indicator change continued to weaken in January. The one-month change, however, recovered marginally – this could be a precursor to the six-month change bottoming over the next several months.
The suggestion that economic momentum will reach a low around July does not imply an optimistic assessment of prospects for later in 2019. Developments judged here to be necessary to warrant such an assessment include:
- A further pick-up in G7 plus E7 six-month real narrow money growth to 3-4% (not annualised) from January’s level of 1.9%.
- Confirmation of a bottoming out of the six-month leading indicator change by April (data to be released in early June).
- Sufficient weakness in stockbuilding and business investment data in the first half of 2019 to suggest completion of cycle downswings during the second half.
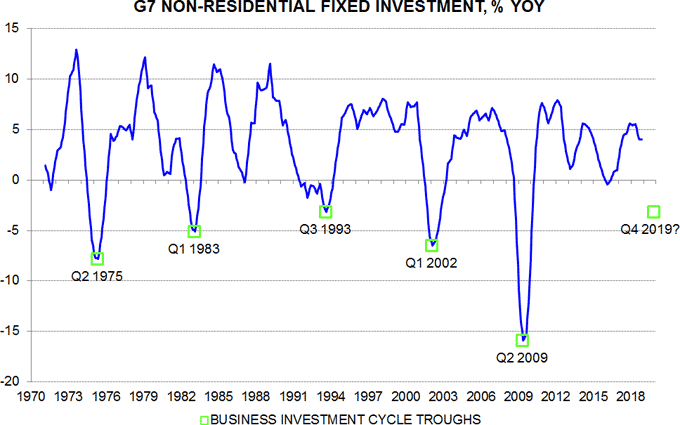
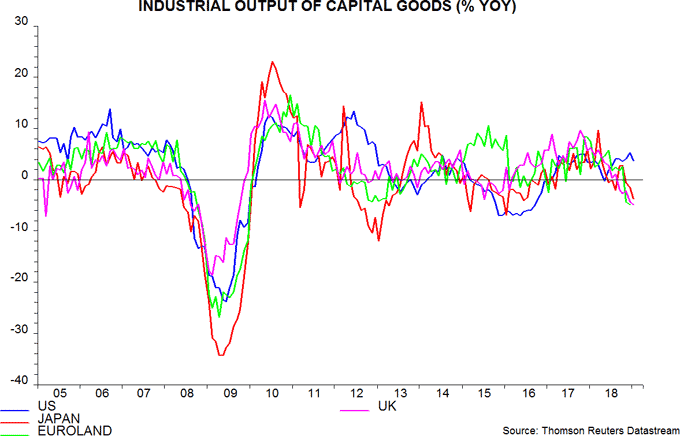
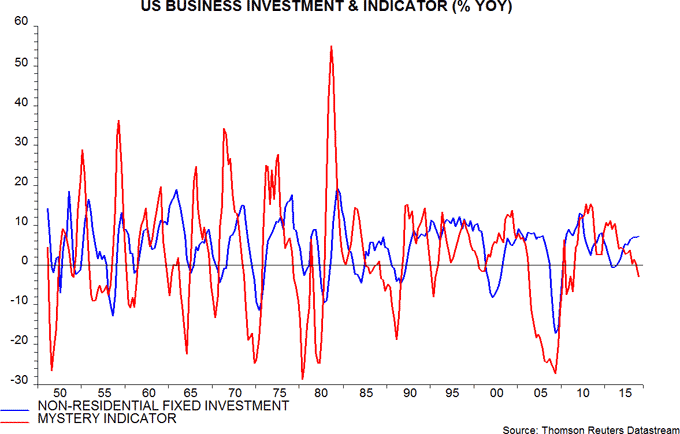
On the latter point, a correspondent asked whether solid investment data for the US and Euroland in the fourth quarter of 2018 altered the assessment here about the timing and magnitude of a cycle downswing. The answer is no. Year-on-year growth of G7 non-residential fixed investment was unchanged in the fourth quarter and below a peak reached in the second quarter – third chart. Investment is closely correlated with industrial output of capital goods, which fell significantly year-on-year in Japan, Euroland and the UK in December / January – fourth chart. The relationship shown in the fifth chart, meanwhile, suggests that US investment resilience will crumble – the identity of the mystery indicator may surprise readers.
