
Entries from March 1, 2018 - March 31, 2018
UK monetary alarm bells ringing louder
 Simon Ward
 Post a Comment
UK monetary trends continued to weaken in February, suggesting deteriorating economic prospects and arguing for the MPC to hold off on plans to raise interest rates.
The preferred narrow and broad money aggregates here are non-financial M1 and M4, comprising money holdings of households and private non-financial corporations (PNFCs). Annual growth rates of the two measures fell further to 5.0% and 3.5% respectively in February, the lowest since 2012 and down from peaks of 10.1% and 6.8% in September 2016 – see first chart. The monetary slowdown has been reflected in a decline in annual growth of nominal GDP, to 3.1% in the fourth quarter of 2017. Such a rate of increase, if sustained, would suggest an undershoot of the 2% inflation target over the medium term, assuming trend real economic expansion of around 1.5%.

Discussion of UK monetary trends normally focuses on the Bank of England’s M4ex measure, which includes broad money holdings of non-intermediate other financial corporations (OFCs) as well as those of households and PNFCs. Annual growth of M4ex fell to 4.5% in February but is in line with its average over 2013-17, giving a more favourable impression of economic prospects than the non-financial measures. M4ex, however, continues to be inflated by rapid expansion of non-intermediate OFC money holdings, which rose by 10.2% in the latest 12 months and are up by a quarter since February 2016. Such holdings appear to contain little information about near-term spending prospects but have been correlated recently with current (not future) share price movements: market weakness, therefore, suggests a fall in their growth rate – second chart.

Returning to the non-financial money measures, shorter-term trends have weakened significantly further since the November interest rate increase, signalling a likely further fall in annual growth rates. Non-financial M1 rose at an annualised rate of 1.6% in the three months to February, with non-financial M4 growing by 1.1% – third chart.

The fourth chart shows the six-month rate of change of real (i.e. deflated by consumer prices) non-financial M1 and household / PNFC components. Aggregate growth fell to just 0.1% in February, with household real M1 in contraction and the PNFC component continuing to slow, consistent with deteriorating prospects for both consumer spending and business investment. These trends, coupled with global monetary weakness discussed in previous posts, suggest that Bank of England and Office for Budget Responsibility forecasts of GDP growth during 2018 (i.e. in the year to the fourth quarter) of 1.8% and 1.4% respectively will be undershot, possibly significantly.

Euroland economic prospects still deteriorating
Euroland monetary trends and the OECD’s composite leading indicator continue to soften, suggesting that a recent economic slowdown will extend through late 2018, at least.
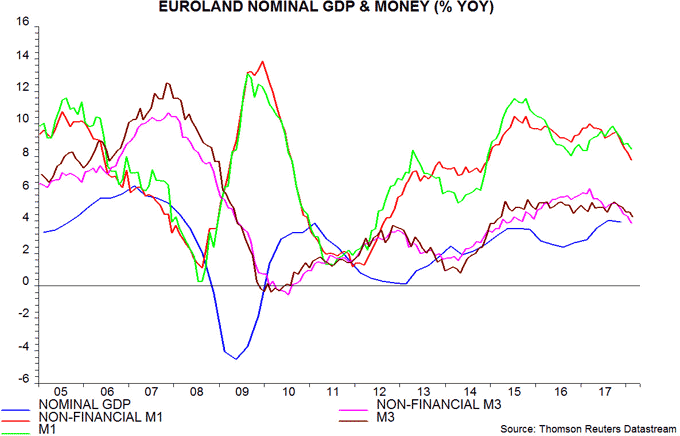
Annual growth rates of the headline M1 and M3 money measures fell to 8.4% and 4.2% respectively in February, extending a decline from peaks in September 2017 of 9.8% and 5.2% respectively. The preferred narrow and broad aggregates here are non-financial M1 and M3*, reflecting their superior historical forecasting performance. These measures have slowed more significantly, with annual growth down to 7.8% for non-financial M1 and 3.9% for non-financial M3 in February, the lowest since 2014-15 – see first chart.
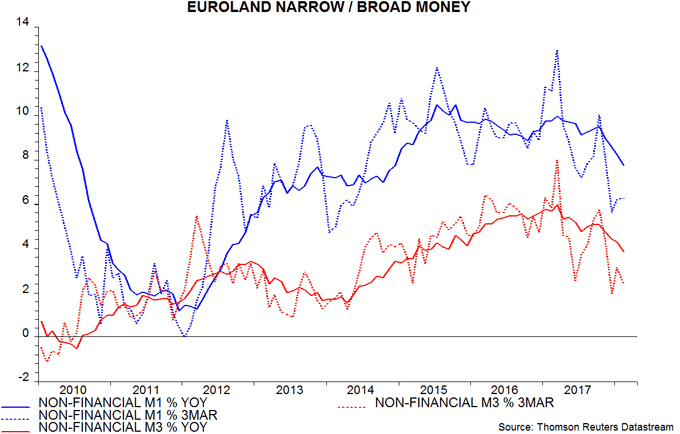
Shorter-term trends suggest that annual growth rates will subside further. Non-financial M1 rose at an annualised rate of 6.3% in the three months to February, with non-financial M3 growing by only 2.4% – second chart.
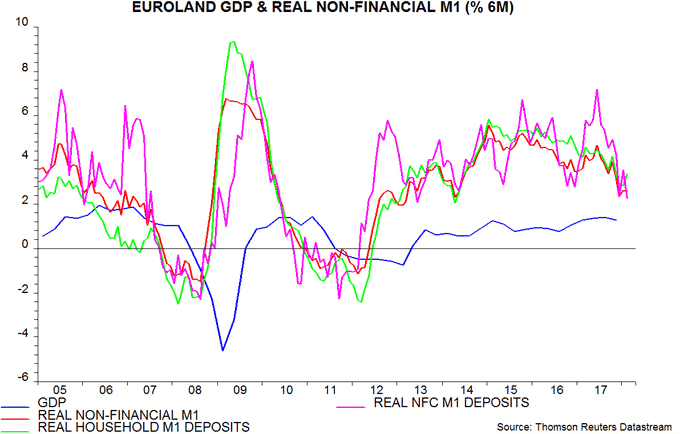
The third chart shows six-month growth of real (i.e. deflated by consumer prices) non-financial M1 and household / corporate components. Aggregate growth is back around its level in late 2012 through early 2014, following which GDP grew at an annualised rate of 1.0-1.5% – well below current consensus and ECB forecasts. Corporate holdings have slowed particularly sharply in recent months and exhibited a stronger correlation with future GDP than household holdings historically, according to ECB research.
The ECB publishes a country breakdown of overnight deposits, which account for more than 80% of M1. Six-month growth of real deposits has fallen steeply in France and Spain since August-September 2017, converging with sluggish German expansion – fourth chart. Recent weaker French business surveys are consistent with the monetary slowdown and suggest that President Macron’s economic honeymoon period has ended. Italian real deposit growth, surprisingly, held up through February but increased policy risk following this month’s election could lower confidence / spending intentions and encourage capital flight, thereby weakening monetary trends.

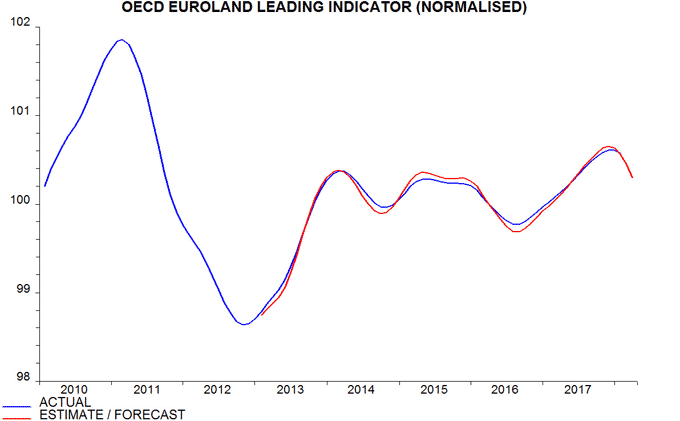
The OECD’s Euroland composite leading index, which typically lags monetary trends by several months (and excludes money measures), confirms softer economic prospects. The normalised version of the index is estimated to have declined again in February, with a further reduction projected for March – fifth chart**. The normalised index is designed to predict GDP relative to trend, so the shift from rising to falling suggests that recent strong growth will give way to below-trend expansion.
*Non-financial = covering holdings of households and non-financial corporations (NFCs), i.e. excluding financial sector money.
**The OECD is scheduled to release a February reading on 10 April but most of the component information is available, allowing an independent calculation.
Is the UK MPC about to make another policy mistake?
Today’s UK labour market release is likely to cement MPC plans to hike rates again in May. Monetary trends suggest that the Committee should hold off.
Annual growth of average weekly earnings, smoothed by a three-month moving average, rose to 2.8% in January from an upwardly-revised 2.7% in December. Growth of regular earnings – excluding bonuses – was lower at 2.6%, though moved up to 2.8% on a single-month basis in January. Pay trends appear slightly stronger than the MPC expected at the time of the February Inflation Report, which suggested that regular earnings growth would average around 2.75% during the first half of 2018.
MPC hawks will also take note of a rebound in aggregate hours worked in the three months to January after a surprise drop in the prior three months, suggesting that a pick-up in growth of productivity (i.e. output per hour) in the second half of 2017 was temporary. The unemployment rate, meanwhile, returned to its recent low of 4.3% in the three months to January.
Why, then, should the MPC delay hiking again? Current labour market conditions are a lagged reflection of above-trend economic growth in 2016-17, which was signalled by strong monetary trends through late 2016. A subsequent significant monetary slowdown argues that economic prospects have deteriorated, implying that labour market strength will ebb and medium-term inflation risks are receding.
Annual growth rates of non-financial narrow (M1) and broad (M4) money fell to 5.3% and 3.7% respectively in January, the lowest since 2012 – see first chart. Trends appear to have weakened further since the November rate hike, with monthly growth of the two aggregates averaging only 0.1% in December / January.

The case for the MPC holding off, it should be emphasised, is unconnected to yesterday’s news that consumer price inflation dropped to 2.7% in February from 3.0% in January. Inflation is expected here to remain around its February level through late 2018. The overshoot, however, is a consequence of past policy laxity relative to monetary and economic conditions – belated remedial action risks compounding the error.
As previously discussed, weaker monetary trends have already been reflected in a slowdown in nominal GDP, annual growth of which subsided to 3.2% in the fourth quarter, compared with a peak of 5.2% in the fourth quarter of 2016. Today’s public finances release suggests that this slowdown is feeding through to government receipts, casting doubt on Chancellor Hammond’s optimism about fiscal headroom in last week’s Spring Statement – second chart.

Softer receipts hint that labour market strength may be peaking, as does a fall in outstanding vacancies in the three months to February – the first decline since June 2017.
Today’s CBI industrial trends survey for March, meanwhile, was weak, with the output expectations balance down further and the balance reporting more-than-adequate finished goods stock levels surging – third chart.

Chinese activity firmer but money trends still signalling weakness
Stronger Chinese economic activity numbers for January-February may partly reflect a holiday timing effect but are also consistent with resilient monetary growth in mid-2017. More recent monetary weakness suggests a progressive loss of economic momentum over the remainder of 2018. Money growth measures were little changed in February but a significant rebound is unlikely without policy easing.
Most activity series came in above consensus expectations in January-February. Annual growth of industrial production, for example, rose to 7.2% from 6.2% in December. The late timing of the New Year holiday may have contributed to this pick-up, by pushing some of the usual production loss into March. The New Year also occurred in mid-February in 2015, 2010 and 2007 – annual production growth was lower in March than in January-February in all three cases, by an average of 1.6 percentage points, i.e. growth may fall back to or below its December level this month.
Current economic resilience, however, is consistent with earlier monetary trends. Six-month growth of real narrow money remained solid by historical standards through September 2017, before falling sharply over October-January – see chart. A further slight decline in February reflected a pick-up in six-month consumer price inflation, probably also influenced by the late New Year. Allowing for a typical nine-month lead, this suggests a significant weakening of economic data from mid-2018.
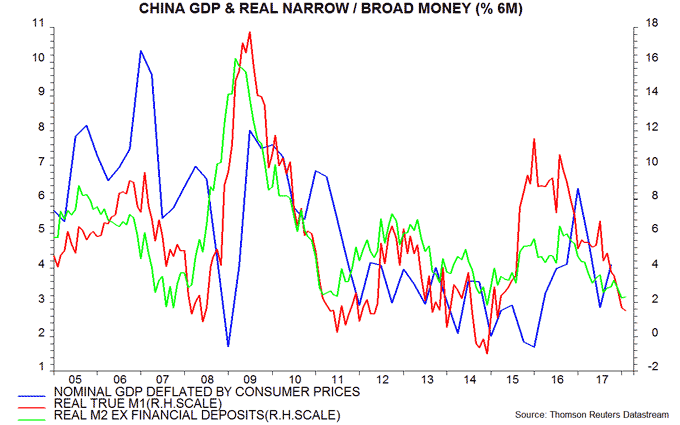
Broad money trends are similarly downbeat: six-month growth of real broad money was unchanged in February near the bottom of its range in recent years.
Business surveys have been mixed recently but are probably peaking. The PBoC’s first-quarter survey of 5000 enterprises reported a small decline in the domestic orders index and a levelling out of the export orders index, after adjusting for seasonal movements – second chart.

UK Spring Statement: Hammond hemmed in
Hopes that recent lower-than-expected borrowing would create room for Chancellor Hammond to loosen the fiscal reins in his autumn Budget have been dented by the Office for Budget Responsibility’s latest forecast.
The OBR revised 2017-18 borrowing down by only £4.7 billion versus expectations of up to £10 billion. Moreover, the reduction in current and future years is attributed to a cyclical boost from the economy operating at a higher level relative to potential rather than an improved structural position. The OBR left its forecast for the structural deficit in 2020-21 unchanged at 1.3% of GDP – well within the “fiscal mandate” requirement of below 2.0% but implying no additional headroom relative to the November forecast.
The new economic numbers are similarly conservative: average GDP growth of 1.4% per annum over 2018-22 is marginally lower than in November, while the OBR has dismissed recent better productivity performance as a temporary blip.
The borrowing undershoot in 2017-18 reflects stronger growth of nominal GDP and receipts than the OBR projected. The new forecast shows nominal GDP growth falling from 3.8% in 2017 to 3.1% in 2018. This looks realistic and may even prove over-optimistic: the year-on-year rise in nominal GDP eased to 3.2% in the fourth quarter of 2017 and monetary trends suggest a further slowdown – see chart.

Global money data still weakening
The global narrow money slowdown appears to have extended in February, suggesting that 1) economic prospects for later in 2018 continue to deteriorate and 2) the liquidity backdrop for equities and other risk assets remains unfavourable.
The US, China, Japan and India have released monetary data for all or part of February. Based on this information and available inflation data, six-month growth of real narrow money in the G7 plus E7 economies is estimated to have fallen to about 0.75% (not annualised) – a significant further drop from 1.3% in January*. It last moved below 1% from above in November 2007, in the early stages of the financial crisis and ahead of the 2008-09 recession – see first chart.

That recession, and all previous global economic downturns since the 1960s (at least), were preceded by a contraction of real narrow money. The expectation here is that the six-month growth rate will stabilise or recover slightly over coming months, reflecting a moderation in six-month consumer price inflation and a partial reversal of recent US weakness. Even if this proves correct, the monetary slowdown since mid-2017 promises a significant downshift in economic growth over the remainder of 2018.
The further fall in global real narrow money growth in February was driven by the US, where the six-month change appears to have turned negative. Chinese growth is estimated to have been little changed in February after a large fall in January**, while Japanese growth weakened slightly further – second chart.

*The four countries mentioned account for 62% of the G7 plus E7 aggregate. The estimate assumes unchanged money growth and / or inflation in countries for which February data are not yet available.
**China has released data for M1 / M2 but not household demand deposits, which are included in the narrow money measure tracked here. The estimate assumes a 7% month-on-month rise in such deposits, based on experience in previous years with a late New Year holiday.
