Entries from March 1, 2016 - March 31, 2016
UK economy defying consensus gloom
UK GDP and monetary data released today support the upbeat view here of current and prospective economic performance – see previous post.
GDP is now estimated to have risen by 0.6% between the third and fourth quarters of 2015, up from 0.5% previously. The upgrade was due to the services sector, where output increased by a bumper 0.8% – the strongest quarterly gain since the fourth quarter of 2015.
Strong services momentum has carried over into the first quarter, as suggested by January turnover data discussed in the earlier post. Services output rose by a monthly 0.2% in January to stand 0.5% above the fourth-quarter level. Also taking into account industrial and construction output data, GDP in January was an estimated 0.4% higher than in the fourth quarter – see first chart. Growth for the first quarter as a whole, therefore, is on course to match or beat the 0.6% fourth-quarter gain.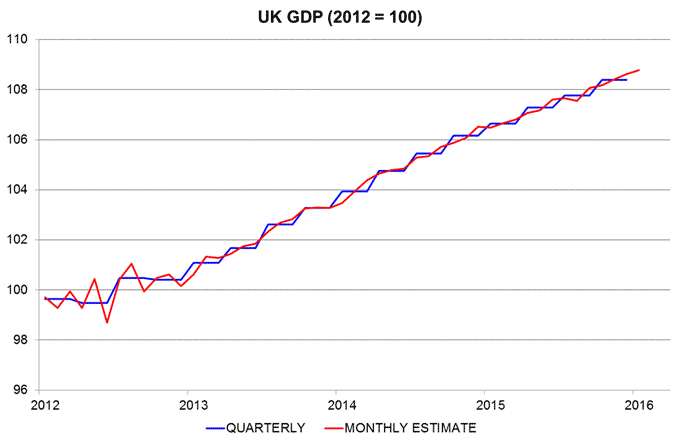
Recent stronger economic performance was foreshadowed by a pick-up in money and credit growth during 2015. This pick-up has extended in early 2016. The preferred narrow and broad aggregates here are non-financial M1 and M4, covering money holdings of households and private non-financial corporations (PNFCs)*. Annual growth of non-financial M1 was 8.2% in February, a 15-month high. Annual non-financial M4 growth rose to 5.9%, the fastest since June 2008 – second chart.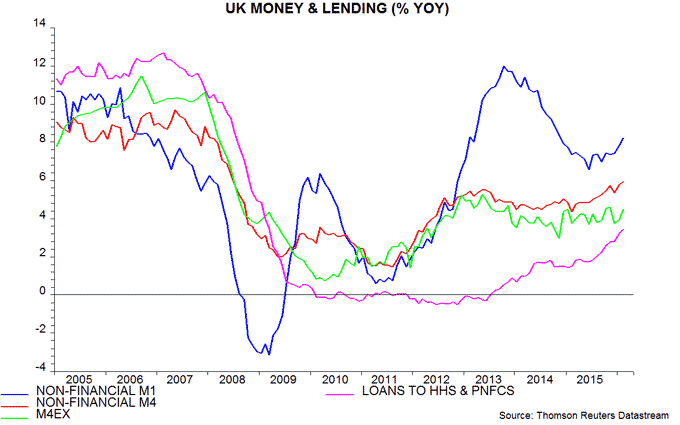
The Bank of England’s favoured broad aggregate, M4ex, is growing more slowly – an annual 4.5% in February. This reflects its inclusion of money holdings of non-bank financial institutions (excluding intermediaries), which fell by 4.1% in the latest 12 months. Such holdings are less relevant for judging near-term spending prospects.
Credit trends, meanwhile, continue to strengthen, with annual growth of bank lending to households and PNFCs up to 3.4% in February, the fastest since March 2009 – second chart. Total bank credit to the private sector (i.e. M4ex lending, including credit extended to non-bank financial institutions) rose by 4.8% in the latest 12 months.
The “best” monetary forecasting indicator, in terms of reliability in signalling GDP turning points over the last 50 plus years, is real (i.e. inflation-adjusted) non-financial M1. Six-month growth of this measure fell between September 2013 and November 2014 ahead of a moderation in two-quarter GDP expansion between the third quarter of 2014 and the second quarter of 2015 – third chart. Real money growth, however, has risen since September 2015 and the GDP / output data discussed above suggest that the economy is already responding, with stronger momentum likely to extend into the summer, at least.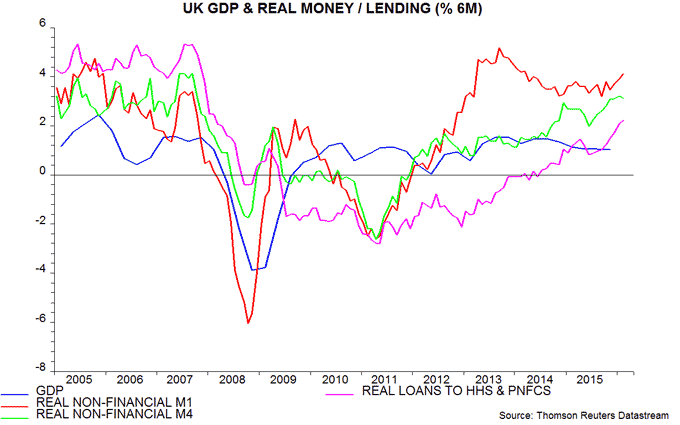
The gloomy consensus forecast of GDP growth of only 2.0% in 2016 seems to assume that Brexit uncertainty will weigh on spending, even if the June referendum delivers a remain result. Any such drag, however, has arguably been more than offset by the MPC delaying further a rise in interest rates and associated exchange rate weakness.
In other news today, the current account deficit widened to £32.7 billion, or a record 7.0% of GDP, in the fourth quarter of 2015. The shortfall, however, was more than offset by a valuation gain on existing stocks of assets and liabilities: the net international investment position (NIIP) improved from -£185.5 billion to -£65.9 billion over the quarter. The NIIP has risen by £60.8 billion over the last five years despite a cumulative current account deficit of £311.3 billion.
*M1 = notes / coin plus sight deposits. M4 = M1 plus other sterling deposits, repos and short-maturity bank paper.
Eurozone money trends stable / solid
Eurozone money and credit trends continue to give a positive signal for economic prospects. GDP and domestic demand rose by 1.6% and 2.2% respectively in the year to the fourth quarter of 2015 and may grow at similar rates during 2016 (i.e. well above “potential” economic expansion estimated by the EU Commission, IMF and OECD at 1.0-1.2% in 2016).
The “best” monetary measure for economic forecasting, according to ECB research, is real (i.e. inflation-adjusted*) non-financial M1, comprising currency holdings and overnight deposits of households and non-financial corporations. This contracted before the 2008 and 2011 recessions, rebounding strongly before the 2009 and 2013 recoveries. Six-month growth of this measure rose to 5.0% in February, or 10.3% annualised. Growth has been rangebound at a high level since early 2015, consistent with stable, solid economic expansion – see first chart.
There is no country breakdown of non-financial M1 but the ECB publishes country data on total overnight deposits (i.e. including those of financial corporations). The six-month change in real overnight deposits is strong in Spain and France, and solid in Italy and Germany – second chart. In other countries (not shown), it is particularly strong in Portugal and weak only in the Netherlands, reflecting a fall in cash pooling deposits, which may have little economic significance.
Broad money M3 rose by an annual 5.0% in nominal terms in February, unchanged from January. This is above the ECB’s 4.5% “reference value” deemed to be consistent with its inflation target and strong in real terms relative to a 12-month change in consumer prices of -0.2% in February.
Annual M3 growth, however, is below a peak of 5.4% in April 2015, just after the ECB launched QE. This mirrors experience in the US, UK and Japan, where QE also seemed to have little broad money impact. As discussed in previous posts, QE was ineffectual in monetary terms because it was associated with 1) increased selling or reduced buying of government securities by commercial banks and / or 2) a deterioration in the basic balance of payments position and a consequent fall in the banking system’s net external assets.
The latter has been the dominant factor in the Eurozone to date. As the third chart shows, an increased contribution to annual M3 growth of banking system lending to general government since QE was launched has been matched by the contribution of banks’ net external assets shifting from positive to negative.
*Consumer prices used for adjustment here.
Is the UK economy reaccelerating?
UK monetary trends continue to give an upbeat message for economic prospects, contrary to consensus gloom. Incoming news is consistent with this positive assessment.
The average prediction for GDP growth in 2016 has fallen from 2.3% in December to 2.0% in March, according to the Treasury’s monthly survey of forecasters. Increased pessimism may reflect recent weaker purchasing managers’ survey results and confirmation of a summer Brexit referendum, which many expect to cause near-term spending restraint.
The purchasing managers’ surveys are regarded here as of little value for forecasting purposes. They rarely lead the economy, and minor fluctuations within the normal range are poorly correlated with GDP growth. They sometimes give misleading signals, as in late 2012, when weak readings contributed to “triple-dip” hysteria, even as economic growth was starting to pick up strongly.
Monetary trends, by contrast, gave clear warning that the economy would surprise on the upside in 2013. Six-month growth of real (i.e. inflation-adjusted) narrow money, as measured by non-financial M1*, rose steadily during 2012 and continued to surge in the first half of 2013 – see first chart.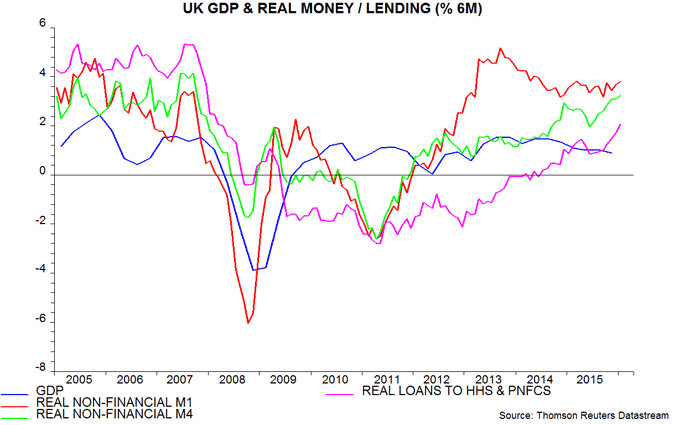
Real narrow money growth moderated later in 2013 and in 2014, a decline that was mirrored by some loss of economic momentum from mid-2014. It stabilised, however, at a solid level and has firmed slightly recently.
Broad money and credit trends, meanwhile, are significantly stronger than in 2012-13. Six-month growth of real non-financial M4* reached an eight-year high in January – first chart. Real bank lending to households and private non-financial corporations (PNFCs) has also accelerated – the “credit impulse”, therefore, is positive.
GDP is currently estimated to have risen by 0.9%, or 1.8% annualised, during the second half of 2015 (i.e. between the second and fourth quarters). Stronger money / credit trends since mid-2015 suggest that GDP momentum will pick up during 2016.
Incoming news is consistent with this assessment but is being ignored by the consensus. The Citigroup UK economic surprise index was negative for most of 2015 but turned positive in February and recently reached a 23-month high.
Claimant-count unemployment is usually sensitive to changes in economic momentum and has fallen at a notably faster pace since late 2015. A similar pick-up in the rate of decline occurred in early 2010 and early 2013 when GDP was accelerating – second chart.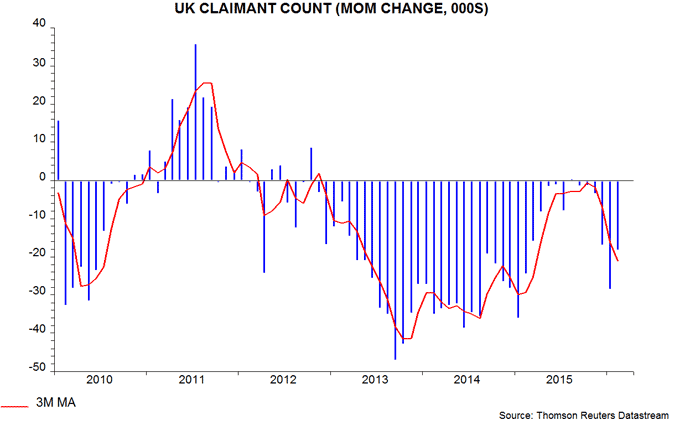
Services output rose by 0.7% in the fourth quarter and growth in the first quarter may be similar or stronger. The December level of output was already 0.3% above the fourth-quarter average, while services turnover, which is an important input to the output calculation, increased further in January – third chart. 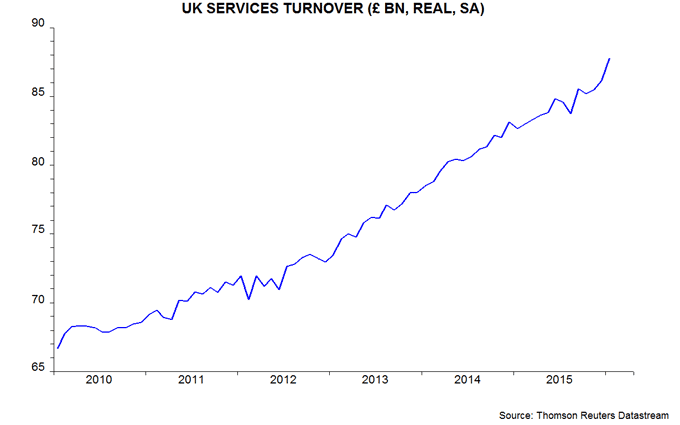
A post in December argued that GDP growth in 2016 would exceed the then-consensus forecast of 2.3% – this view is maintained.
*Non-financial M1 = notes / coin and sterling sight deposits held by households and private non-financial corporations. Non-financial M4 additionally includes holdings of sterling time deposits, repos and bank securities of less than five years’ original maturity.
Forecasting indicators suggest slow growth, not recession
The global economy is weak but not recessionary. GDP in the G7 developed economies and seven large emerging economies (the “E7”) rose by 1.1% between the second and fourth quarters of 2015, equivalent to an annualised rate of 2.1%*. The latter compares with average growth of 2.9% per annum (pa) since 1997 but is no weaker than in the same period of 2012 – see first chart.


UK Budget: smoke, mirrors and gambles
Chancellor George Osborne presented another hyperactive Budget combining apparent fiscal rectitude with a range of popular measures. The reality is that his forecast numbers rely on accounting tricks, unspecified future spending reductions and more stealth taxes, and would be blown out of the water by another recession or a rebound in borrowing costs.
As expected, the Office for Budget Responsibility revised up its baseline borrowing numbers significantly, despite another cut in forecast debt interest payments, reflecting greater pessimism about trend productivity growth. How, then, did Mr Osborne manage to claim that he remains on track to achieve a fiscal surplus of more than £10 billion in 2019-20 and 2020-21?
There were two main tricks. First, he shifted a significant chunk of revenue from 2017-18 and 2018-19 into the two later years by delaying a previously-announced acceleration of corporation tax payments. That is, he will borrow more in 2017-18 and 2018-19 to “fund” his surpluses in the later years.
Secondly, he pencilled in large but unspecified cuts in current spending in 2019-20 and 2020-21. He disguised part of this reduction as an increase in pension contributions by public sector employers – these higher contributions will be met from existing budgets, implying that savings must be found elsewhere.
The remainder of the Budget consisted of more tax system meddling to conjure up revenue to fund his populist announcements. A problem here is that the additional yield from the revenue-raising measures is more uncertain than the cost of the giveaways.
As usual, the Chancellor expects a further attack on “avoidance and evasion” to do the heavy lifting, with a list of 14 measures forecast to raise more than £3 billion in 2019-20. This essentially pays for the announced increases in the personal allowance and higher rate thresholds, generous changes to the ISA regime and another fuel duty freeze.
The business tax changes are similarly self-financing, with cuts in a range of exemptions benefiting large corporations and higher stamp duty on commercial property transactions used to fund a big rise in rate relief for small businesses and a reduction in the main corporation tax rate to 17%.
Contrary to the Chancellor’s claims, there is still a gaping hole in the UK’s fiscal roof. Lowered spending targets will be tough to achieve and the OBR’s forecasts also rely on doubly-favourable assumptions of sustained economic growth and little rise in interest rates. For all his bravado, Mr Osborne may be hoping for a move out of no. 11 before the economic weather changes.
Chinese economy soft in early 2016, money signal still positive
Chinese economic activity numbers for January-February were disappointing but may have been depressed by New Year timing effects. Money / credit trends continue to give a positive signal for prospects.
Annual growth in industrial output fell from 5.9% in December to 5.4% in January-February. The decline may reflect an unfavourable base effect due to Chinese New Year falling unusually late in 2015 – 19 February versus 8 February this year. Late New Year dates seem to boost February production at the expense of March, probably because factories take time to return to normal operation after the holiday. So production may have been higher than trend in February 2015 but below it in March. This would depress annual growth in January-February 2016 but suggests a rebound in March.
This, indeed, was the pattern after the New Year was last similarly late, in 2007 (18 February). Annual production growth in January-February 2008 was 2.0 percentage points (pp) below the December level but rebounded by 2.4 pp in March.
There were several brighter spots in the January-February data releases. Annual growth of total fixed investment value recovered from 8.2% in December to 10.2%, driven by a 41% rise in new projects. The pick-up, however, was state-led, with private investment growth slipping further to 6.9%.
Housing market activity, meanwhile, strengthened, with floorspace sold up by 30% from January-February 2015, suggesting a further recovery in house prices. The start of the year, however, is a relatively quiet period for transactions – January-February accounted for only 9% of full-year sales in 2015.
While economic news was, on balance, disappointing, money / credit trends continue to suggest brighter prospects. Monthly changes in the key aggregates weakened in February after a super-strong January, but six-month growth of real (i.e. inflation-adjusted) narrow money* has risen markedly since mid-2015, with a smaller but still significant increase in real total social financing expansion** – see chart. Allowing for a typical nine-month lead from monetary changes to the economy, activity news should improve soon.

*The preferred narrow money measure here is “true M1”, comprising currency in circulation and demand / temporary deposits of corporations and households. The official M1 measure omits household deposits. True M1 is not yet available for February.
**Total social financing (TSF) = domestic fund-raising by households and non-bank corporations. TSF does not take account of repayments of external corporate debt but also omits recent heavy bond issuance by local governments, the proceeds of which have been used in part to repay bank debt of related corporate financing vehicles. The net effect of these influences has probably been to depress recorded TSF growth.

