Entries from March 1, 2015 - March 31, 2015
Global money signal still positive
Contrary to claims that a strong US dollar is tightening liquidity conditions, six-month growth of global* real narrow money appears to have risen further in February, suggesting solid second-half economic prospects.
The US, China, Japan, India and Brazil have released February monetary data, together accounting for about 60% of the aggregate tracked here. Assuming stable six-month changes elsewhere, the global measure should reach its highest level since December 2011 – see first chart.
The rise in global real money growth over October-January reflected an energy-driven fall in inflation. The February increase, by contrast, was due to faster nominal expansion – second chart.
Real money growth surged in the G7 but fell back in the emerging E7, pushing the G7 / E7 gap to its highest since January 2012 – third chart. The G7 rise was mainly due to the US – see previous post. Japanese real money growth firmed but continues to lag the Eurozone / US. February Eurozone data will be released on 26 March.
E7 growth has been held down by contractions in Russia and Brazil. Real money is expanding moderately in China and India. The strongest growth recently has been in Mexico and Korea – fourth chart.
*G7 plus emerging E7.


Is US dollar strength draining global liquidity?
The global real narrow and broad money measures followed here continue to grow solidly, suggesting a favourable economic outlook. Some commentators, however, argue that US dollar strength is tightening global liquidity conditions, warranting a bearish view of economies and markets. Are they right?
According to these commentators, capital reflux into the dollar is forcing central banks in emerging economies to intervene to support their currencies. This intervention amounts to “reverse QE” and has a contractionary influence on domestic monetary conditions. The negative impact can be measured by the rate of decline of US dollar reserve holdings of foreign central banks. The latter can be proxied on a timely basis by Federal Reserve custody holdings of US securities for foreign official and international accounts*. These dropped by $112 billion between the end of September and 11 March (weekly average data).
The theory underlying this argument is questionable. A flow of portfolio capital into the US will reduce the money supply in the rest of the world but raise it in the US, resulting in no change at the global level, other things being equal**. As noted in a recent post, US money growth has strengthened recently.
The current post, however, focuses on empirical evidence, asking whether US dollar reserves, as proxied by the Fed’s custody holdings, have been a better leading indicator of the economic cycle than the global narrow money (M1) measure tracked here. The main findings are:
- Real custody holdings led major swings in the global economy over the 1970s-1990s.
- However, global real narrow money was less volatile and more reliable in predicting recessions.
- The forecasting performance of real custody holdings has deteriorated since the early 2000s.
- Falls on the recent scale occurred in 2011 and 2014 without an ensuing recession.
The suggested conclusion is that the recent reserves decline would need to accelerate and be reflected in a slowdown in global real narrow money to warrant serious concern about economic prospects.
The first chart below shows the six-month rates of change of G7 industrial output and real narrow money over the last 50 years, with global recessions highlighted by shading. A consistent leading relationship is apparent, with real money contracting before each of the six recessions.
The second chart superimposes the rate of change of real Fed custody holdings***. This series also led the economic cycle reasonably well until the early 2000s but was more volatile than the change in real money and gave more false recession signals.
Unlike narrow money, real custody holdings did not contract before the 2008-09 recession. Fluctuations in recent years have been small by historical standards, with declines also occurring in 2011 and 2014.
A possible reason for the less impressive forecasting performance of real custody holdings since the early 2000s is that emerging economies have shifted away from exchange rate management as a key tool of monetary policy. This argues for monitoring monetary conditions directly via the money supply rather than by proxy using US dollar reserves.
*Foreign official holdings of US Treasury and agency securities totalled $4.6 trillion at end-December 2014, the latest available month, according to US Treasury data. The Fed’s custody holdings were $3.3 trillion as of the same date, implying about 70% coverage.
**A portfolio inflow will improve the US basic balance of payments (i.e. current account plus net direct / portfolio inflows), other things being equal. Overall balance implies an offsetting change in banking flows, i.e. a rise in banks’ net external assets. According to the monetary counterparts arithmetic, such a rise has an expansionary impact on the money supply.
***Fed custody holdings are available from 1972. The earlier series shown refers to foreign official holdings of US government securities, from the quarterly flow of funds accounts.


Chinese money trends signalling moderate economic growth
A post in November noted that Chinese monetary trends were weakening again, suggesting a loss of economic momentum in early 2015 and a need for further policy easing. A slowdown was confirmed by yesterday’s batch of economic data covering January and February. Industrial output, for example, is estimated here to have risen by only 3.0% in the six months to January / February, or 6.2% annualised, versus average growth of 9.3% per annum over the prior three years.
Monetary policy, however, has loosened since November, with two cuts in official interest rates and one in required reserves. This shift is being reflected in a recovery in monetary growth, promising better economic news by mid-year. Six-month growth of real (i.e. inflation-adjusted) M2 rose in January and February, returning to the middle of its recent range. The narrow M1 measure has also rebounded after notable weakness in late 2014 – see first chart.
Credit trends, similarly, have revived, with bank loans regaining market share in response to an ongoing official clampdown on “shadow” financing – second chart.
Global industrial output growth has firmed since summer 2014 despite a Chinese slowdown. The monetary evidence suggests that the Chinese drag will now fade.


Global leading indicator still positive
The OECD this week released January country leading indicator data, allowing an update of the derived global* leading indicator tracked here. This moved sideways in January following a solid December gain, suggesting that the recent upswing in global industrial output growth will continue through mid-year, at least – see chart.
*”Global” = G7 major countries plus seven large emerging economies (“E7”).
US money trends signalling H2 growth rebound
A post in September noted that US narrow money growth had fallen sharply and was signalling a loss of economic momentum in early 2015, allowing for the usual lag. US economic news has mostly disappointed recently, reflected in a significant negative reading of the Citigroup US data surprise index, while the Atlanta Fed’s “nowcast” model suggests GDP growth in the first quarter of only 1.2% annualised.
The slowdown predicted by monetary trends has been magnified by cuts in oil and gas extraction-related investment and employment. New advertisements for extraction jobs and related high-education occupations plunged by 42% and 38% respectively between November and January, according to the Conference Board.
Some commentators claim that economic weakness will be sustained through 2015, with familiar voices even suggesting that a recession is looming. This is not the message from the latest monetary trends.
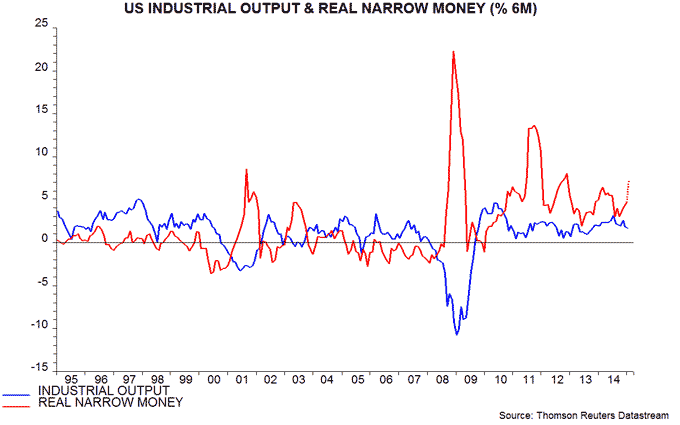
As discussed in a post in January, six-month growth of US real (i.e. inflation-adjusted) narrow money recovered at end-2014, reflecting an energy-driven fall in consumer prices. The revival continued in January and available weekly data for February suggest a further large gain, this time driven by stronger nominal expansion – see chart*.
Broader money measures have also reaccelerated. Based on the weekly data, six-month growth of real M2 probably rose to 4.0% in February, or 8.1% annualised – the highest since December 2011.
Monetary trends, therefore, suggest that current economic weakness will extend into the second quarter but growth will bounce back strongly in the second half of 2015.
Previous posts (e.g. here) noted that 10 of the 11 US recessions since World War Two were preceded by a contraction of real narrow money, the exception being 1953-54 downturn, which may have been caused by fiscal tightening as defence spending was slashed after the Korean War. A 2015 recession remains unlikely, with the latest monetary trends suggesting a receding risk.
*The February estimate is based on the average level of narrow money through 23 February and an assumed 0.4% monthly increase in consumer prices.
G7 "core" inflation stable, close to 10-year average
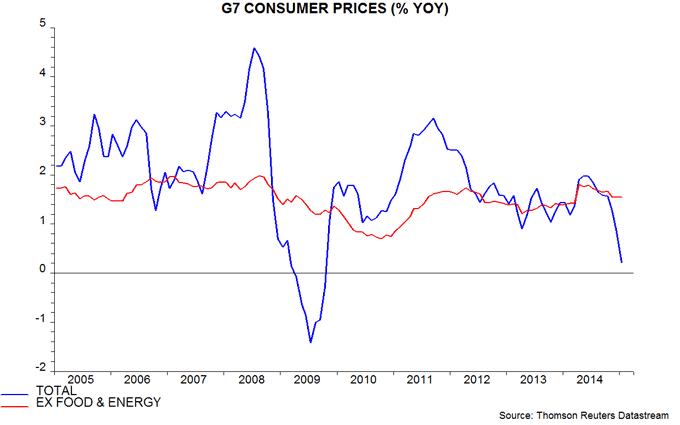
G7 annual consumer price inflation fell to 0.2% in January, the lowest since October 2009, but the “core” rate excluding food and energy was unchanged at 1.6% – see first chart. Stable core inflation suggests that deflation worries are overblown.
The G7 headline and core rates are currently subject to a small upward distortion from last April's Japanese sales tax hike. Without this, core inflation would be 1.4% – close to its average of 1.5% since 2005.
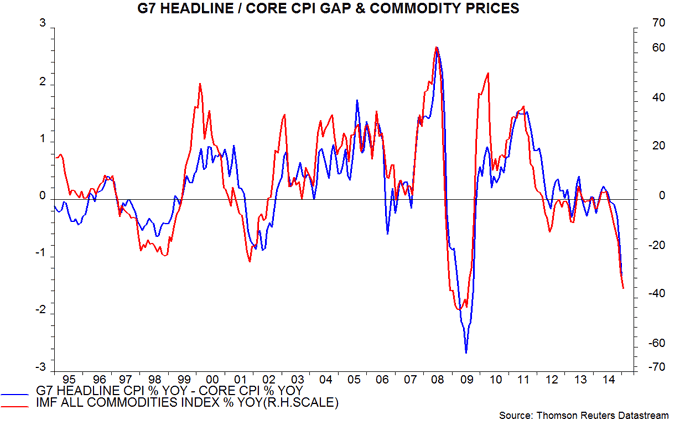
The second chart shows the headline / core inflation gap and the annual rate of change of commodity prices, as measured by the IMF’s all-items index. The headline / core gap is probably at or close to a bottom, assuming no further fall in commodity prices.
Core inflation is likely to be supported by increasingly tight labour markets and associated upward pressure on wages and unit labour costs. As previously discussed, job openings rates (i.e. vacancies expressed as a percentage of filled and unfilled jobs) are at or above their 2000s cyclical highs in the US, Japan, Germany and the UK. Wage growth is firming in all four economies, while productivity trends remain weak.
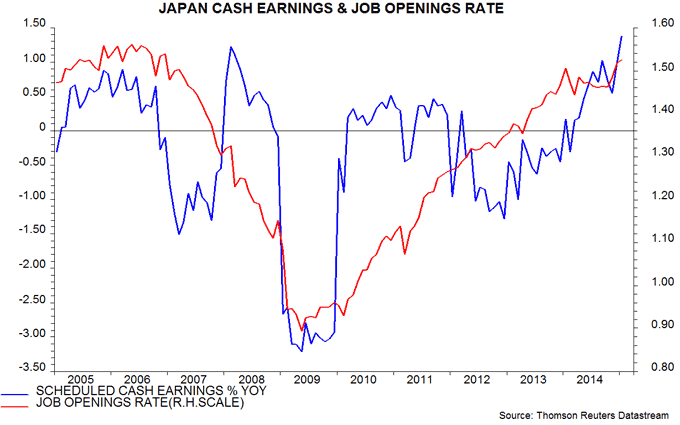
In Japan, annual growth in scheduled earnings (i.e. excluding overtime and bonuses) at firms with 30 or more employees rose to 1.3% in January, a 15-year high – third chart. With the job openings rate up again, and profits buoyant, workers are in a strong position to push for further wage gains in the spring “shunto”.


