
Entries from March 1, 2012 - March 31, 2012
UK Budget falls short of tax-reforming boast
 Simon Ward
 Post a Comment
The measures announced are disappointing relative to the billing as a tax-reforming Budget that will lift growth.
A tax-reforming Budget would have slashed marginal rates for the majority of tax-payers to boost incentives to work, save and invest. The rise in the personal allowance is welcome but cuts the marginal rates of no more than 7% of taxpayers (i.e. two million out of 30 million). The offsetting reduction in the basic rate limit, moreover, implies that more earners will be drawn into the 40% band. The cut in the top rate to 45%, meanwhile, affects only 300,000.
A tax-reforming Budget would also have tackled unwelcome humps in marginal rates associated with plans to withdraw child benefit from higher-rate taxpayers and the withdrawal of the personal allowance above £100,000.
The main growth-boosting measure is a faster cut in corporation tax to 22% by 2014-15 but the change is marginal and unlikely to have a major impact on business confidence and investment.
Within the details, there is a large element of robbing Peter to pay Peter. The cost of the corporation tax cut, for example, is exceeded by increases in other business revenues, stemming from a higher bank levy, changes to North Sea taxation and controlled foreign company rules. The rise in the personal allowance, meanwhile, is partly paid for by freezing age-related allowances and extending VAT.
The OBR’s fiscal forecasts are little changed from November but its assessment that the Chancellor is on track to meet his targets assumes that plans to step up spending restraint will be achieved. Government actions cut the deficit by £41 billion in 2010-11 and 2011-12 combined, split between £23 billion of expenditure reductions and £18 billion of tax hikes (Budget table 1.2). A further £41 billion adjustment is planned for the next two years but with spending cuts bearing much more of the burden – £34 billion versus tax rises of only £7 billion.
The scale of the challenge that lies ahead is also highlighted by the OBR’s forecasts for cyclically-adjusted borrowing (excluding the impact of the Royal Mail transfer), showing cuts stepping up from 0.6% and 0.7% of GDP in 2011-12 and 2012-13 to 1.6% and 1.2% in 2013-14 and 2014-15 (Budget table D.6). Backloading the adjustment until near the planned date of the next election is an odd strategy for a supposedly politically-attuned Chancellor.
"Surprising" UK inflation stickiness proves failure of "output gapology"
Disappointing February figures support the forecast here that UK CPI inflation will remain comfortably above the 2% target throughout 2012.
The annual CPI increase subsided from 3.6% in January to 3.4% but a larger decline had been expected, reflecting slower energy and food price gains and a favourable VAT base effect – consumer suppliers were probably still passing on the 2.5 percentage point standard rate rise in February last year.
The disappointment is highlighted by an estimate of “core” prices that excludes unprocessed food and energy and attempts to adjust for VAT changes – the calculation assumes that 90% of last year’s standard rate rise was passed on to consumers, with the effect spread over October 2010-February 2011. Annual inflation on this measure rose to a 26-month high of 2.9%, with six-month seasonally-adjusted momentum even stronger – see first chart.
These developments cast strong doubt on the Bank of England’s continued assertion that substantial excess capacity in the economy will bear down on core inflation.
Further evidence of inflationary risks was provided yesterday by the March CBI industrial trends survey, showing a jump in price-raising plans, in turn suggesting a rebound in annual CPI goods inflation – second chart.


US stocks extended relative to history
The chart updates a comparison of the rise in the Dow Jones industrial average from its low on 9 March 2009 with recoveries after six prior bear markets of a similar scale to the 2007-09 decline. A post in February gave further details but the analysis involved:
1) Identifying twentieth-century stock market falls comparable with the 54% decline between October 2007 and March 2009.
2) Aligning the trough of each identified bear market with the March 2009 low and tracing out the subsequent recovery.
3) Calculating a mean of these levels at each point in time to generate a “six-recovery average” path, with which to compare the current advance.
The Dow has moved even further above the six-recovery average since February, with the premium standing at 21% as of Friday’s close.
One of the six prior recoveries involved stronger stock prices at this stage – the recovery after the November 1903 low. This precedent is not encouraging since stocks soon after embarked on another bear decline into a low in November 1907.
The current Dow reading, indeed, is above the mid 2012 levels of all six prior recoveries.
The predictive value of such comparisons is moot but the suggestion that stocks will decline by mid 2012 is consistent with the monetary forecast of a peak in global growth in May – see Friday’s post. As noted there, however, it may be premature to position defensively until a growth peak is confirmed by leading indicators and “excess” liquidity gives a “sell” signal.

Are the economy and markets approaching a peak?
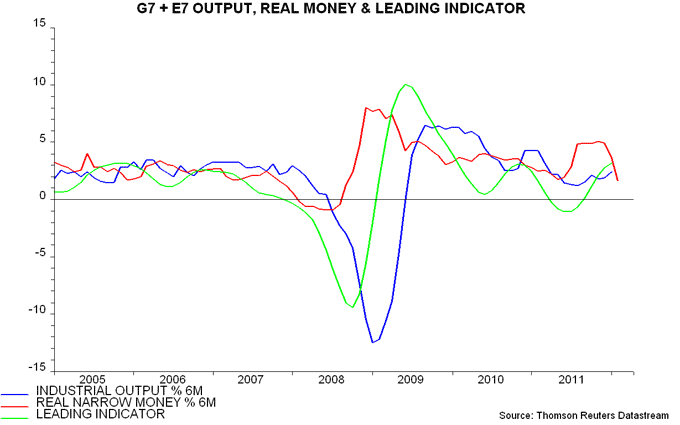
Six-month growth in G7 plus emerging E7 real narrow money topped out in November 2011 and available information suggests a further sharp fall in February – see first chart. Allowing for the typical six month lag between real money and economic activity, this is consistent with industrial output expansion peaking in May and slowing into the second half.
The forecast of a further pick-up in output momentum into May is supported by a shorter-term leading indicator derived from the OECD’s country leading indices. This indicator typically leads by three months and continued to rise in January, based on data released on Monday – first chart. If the monetary signal is correct, the indicator may peak in February, implying a March fall to be reported in mid May.
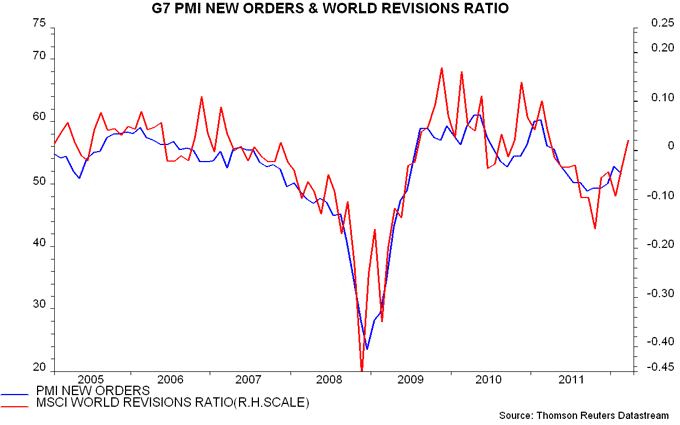
A further indication that near-term economic news may remain firm is that equity analysts are, on balance, revising up their company earnings forecasts. This, in turn, suggests that March manufacturing PMI results will be upbeat – second chart.
Growth peaks are usually associated with at least temporary declines in equities and other risk assets. Should investors cut risk exposure now in anticipation of an economic slowdown after May? Some reduction is probably warranted but it may be too early to position defensively, for three reasons.
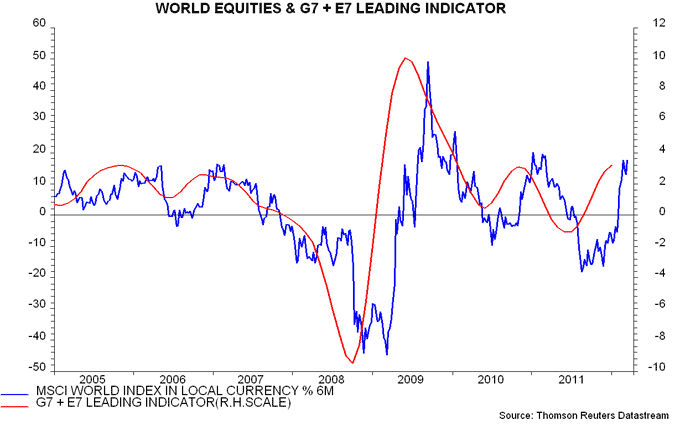
First, equity market tops have tended to coincide with or even lag growth peaks in recent years. A “safe” strategy has been to wait for the leading indicator to fall before cutting exposure, even allowing for the two-month publication lag – third chart. On this view, the earliest date to turn defensive is mid April in the event of a February indicator decline. As noted above, however, the monetary forecast favours March as the first month for a fall.
Secondly, equities, historically, have tended to rise as long as annual growth of global real narrow money exceeds that of industrial output, implying “excess” liquidity – this is still the case now. Six-month rates of expansion, however, have crossed, based on the provisional February real money number – first chart. This could presage a “sell” signal from the annual comparison in mid 2012.
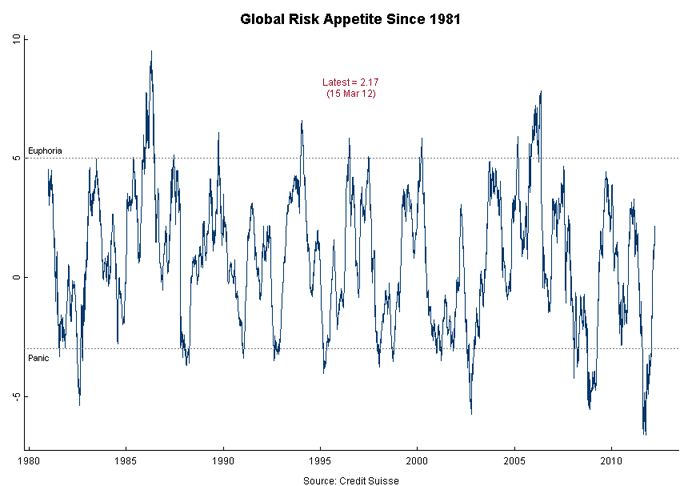
Thirdly, investor sentiment, while recovering dramatically since late 2011, has not yet reached an overbought extreme characteristic of major equity market tops, at least judging from the normally-reliable Credit Suisse risk appetite measure – fourth chart.
An additional argument for adopting a neutral posture is uncertainty over the monetary impact of the ECB’s liquidity injections – a pick-up in Eurozone real money growth could, in theory, temper or reverse the recent global slowdown. February money supply figures are released on 28 March and will be an important influence on the assessment here (though will not incorporate the impact of the second three-year LTRO conducted late last month).
"Osborne bond" talk obscures falling effective maturity of UK debt
The 100-year “Osborne bond” is intended to “lock in” low long-term borrowing costs by extending the average maturity of the public debt. Any such impact, however, will be small relative to the reduction in the effective maturity of official liabilities stemming from the Bank of England’s QE programme.
According to the Debt Management Office (DMO), the average maturity of gilts and Treasury bills outstanding was 14.5 years at the end of 2011. This figure, however, includes about £275 billion of gilts held by the Bank of England, representing 21% of the stock of debt held outside the DMO.
The market has, in effect, exchanged these gilts for zero-maturity central bank reserves. The relevant metric for assessing refinancing risk is the average maturity of the market's combined holdings of debt and reserves, not that of the stock of debt including the Bank's gilts. This “effective” maturity is estimated to be 11.5 years currently, down from 13.7 years at the end of 2008, just before QE started – see chart. (The calculation assumes, reasonably, that the average maturity of the Bank’s holdings matches the outstanding stock of debt.)
The effective maturity will fall further to an estimated 10.7 years when the Bank completes its £325 billion QE programme, assuming no other changes.
The Bank of England pays Bank rate on reserves. This results in an interest saving when Bank rate is below the initial yield on purchased gilts, as at present. The Bank, however, could be forced to tighten monetary policy aggressively in the event of a funding or inflation crisis. This would be instantly reflected in the combined government / Bank interest bill.
The UK's "true" debt maturity is still significantly longer than for other major countries but QE has eroded the advantage and will swamp the impact of any “Osborne bond”.
US broad money growth moderates, business holdings still soaring
The US broad money supply, on the superior flow of funds accounts measure, slowed during the second half of 2011, consistent with economic growth moderating during the first half of 2012, as also suggested by recent narrow money developments – see previous post.
The flow of funds accounts provide detailed information on the financial holdings of US households, businesses and financial institutions, permitting the calculation of a comprehensive broad money supply measure with an accompanying sectoral breakdown. Fourth quarter accounts were released yesterday. The definition used here comprises currency, US bank deposits (checkable, time and savings), foreign deposits, money market mutual funds and security repurchase agreements. The official M2 definition, by contrast, omits US large time deposits, foreign deposits, institutional money funds and repos.
The flow of funds measure grew by an annual 6.0% in December, up from 5.8% in September – see first chart. Quarterly expansion, however, slowed further from 3.4% annualised to 3.0% – well down from 9.4% in the second quarter of 2011 and 8.3% in the first. The change between the two halves probably reflects QE2 finishing in mid 2011.
A silver lining is that money holdings of non-financial businesses continued to rise strongly during the second half, with the fall in aggregate growth due to a slowdown in household liquidity and an outright fall in the financial sector. Non-financial business money holdings climbed 13.6% in the year to December, a development that should provide support for investment, hiring and take-over activity – second chart.


