
Entries from June 1, 2021 - June 30, 2021
UK inflation forecast update: more upside surprises in H2
 Simon Ward
 Post a Comment
The sharp rise in UK CPI inflation to 2.1% in May supports the long-standing forecast here of a move above 3% in late 2021.
The 2.1% outturn compares with a 2.0% forecast in a post a month ago but there were bigger surprises within the detail. Core inflation – excluding food, energy, alcohol and tobacco – jumped from 1.3% in April to 2.0%. This was partly offset by unexpected further weakness in food prices, which posted a 1.2% annual fall, up from 0.5% in April.
This is an unfavourable combination because the rise in core prices is more likely to stick, with food prices expected to pick up into 2022.
A food rebound is already evident in producer output price inflation for food products, which rose to 3.1% in May and correlates with / leads CPI food inflation – see chart 1,
Chart 1

Headline / core inflation rates are still being suppressed by last year’s VAT cut for hospitality, which is due to be reversed in two stages starting in October. The guesstimate here is that core inflation would be 2.7% in the absence of the cut, based on an assumption of 35% pass-through to consumers.
The revised forecasts shown in chart 2 incorporate one-third of the upside core surprise in May, attributing the remainder to temporary “noise” – this may prove overoptimistic. As before, annual food inflation is assumed to rise to 2.0% by year-end. The previous energy price assumptions are also maintained.
Headline / core rates fall back in June / July because of base effects but rises resume thereafter, with headline inflation reaching 3.2% in November / December.
Chart 2

It should be noted that the end-2020 basket reweighting has had the effect of suppressing recorded inflation in 2021. The new weights reflect spending patterns during the pandemic but expenditure shares are normalising as the economy reopens, with an associated shift in relative prices.
The CPI weight of restaurants and hotels, for example, was cut from 11.9% in 2020 to 8.7% in 2021 but the price index for the sector rose by 3.4% between December 2020 and May, more than double a 1.5% rise in the overall CPI. The cut in the weight also implies that the VAT reversal will have a smaller CPI impact than last year’s reduction.
An alternative approach, which may better reflect consumer experience, is to reuse the 2020 basket weights, based on 2018 spending shares, for the 2021 index calculation. The alternative measure rose by 1.7% between December and May, with its annual increase at 2.4% versus the official 2.1% – chart 3.
Chart 3

Chinese corporate liquidity squeeze suggesting darkening outlook
A case can be made that the most pressing monetary policy issue globally is the timing not of Fed tightening but rather of PBoC easing.
The mainstream view at the start of the year was that China would continue to lead a global economic recovery, resulting in a further withdrawal of monetary and fiscal policy support.
Chinese economic data have disappointed consistently – including May activity numbers this week – but the consensus has maintained a forecast of policy tightening, albeit later than originally expected.
The “monetarist” view, by contrast, is that the PBoC had already moved to a restrictive monetary stance during H2 2020. This was reflected in a money / credit slowdown late last year, which has fed through to a loss of economic momentum in H1 2021.
The PBoC was judged likely to recognise rising downside risks by easing policy by mid-year. Money market rates have been allowed to drift lower since February but May monetary data suggest that policy adjustment has been “too little, too late”.
Six-month growth rates of money and credit fell further last month, signalling likely continued nominal GDP deceleration through year-end, at least – see chart 1.
Chart 1

Weakness is more pronounced in real terms: narrow money has barely kept pace with consumer prices over the last six months and has fallen by 5.5% relative to producer prices – chart 2.
Chart 2

The liquidity squeeze is focused on companies. M2 deposits of non-financial enterprises have stagnated over the last six months, while M1 deposits have fallen – chart 3. Nominal weakness is comparable with 2014 and 2018 – ahead of major economic slowdowns – but real money balances are under greater pressure now, reflecting surging input costs.
Chart 3

The bias here has been to give the PBoC the benefit of the doubt and assume that easing would occur early enough to head off serious economic weakness. Increased pessimism is warranted unless action is forthcoming soon.
Are medium-term inflation risks receding?
The surge in global broad money last spring and summer was expected here to result in a major inflation rise in 2021-22. A post in September presented reasoning supporting a forecast of 4-5% average G7 inflation in the two years to Q4 2022.
Recent data appear consistent with this forecast but monetary developments suggest that medium-term inflation risks are diminishing.
The latter assessment rests on three considerations. First, six-month growth of global (i.e. G7 plus E7) broad money has moved back towards its pre-pandemic pace. Growth was 4.2% in April, or 8.6% at an annualised rate, versus an average increase of 6.6% pa in the 10 years to end-2019.
G7 broad money growth remains elevated relative to the 2010s but E7 growth is at the bottom of its range, with Chinese weakness a key driver – see chart 1.
Chart 1

Secondly, G7 bank loans to the private sector have contracted following a brief spurt last spring, contrary to forecasts that government guarantee programmes and central bank incentives would spark a lending boom – chart 2.
Chart 2

Sustained high inflation in the 1970s reflected strong broad money growth driven by bank lending. Last year’s money surge, by contrast, was due to monetary financing of ballooning fiscal deficits and additional QE.
Bank lending is a coincident / lagging economic indicator and is likely to revive as economic activity continues to recover. "Excess" household and corporate liquidity, however, may delay and / or damp a pick-up in credit demand, while the impact on broad money may be neutralised by reduced monetary deficit financing / QE as fiscal positions improve and central banks taper.
A third reason for thinking that monetary inflation risks may have diminished is that a portion of the excess liquidity created last year has been absorbed – at least for the moment – by higher asset prices.
A simplistic quantity theory approach posits that the demand to hold money varies proportionately with nominal GDP. Money, however, is held as a store of wealth as well as to support transactions in goods and services.
Posts here last year described a modified quantity theory model in which nominal GDP and gross wealth have equal roles in driving broad money demand, with an additional impact from real bond yields. This model is consistent with G7 data over the last 50+ years and explains the secular decline in conventionally-defined broad money velocity as a consequence of a rising trend in the ratio of wealth to GDP and a fall in real bond yields.
The current stock of G7 broad money is 20% higher than at end-2019. G7 gross wealth – i.e. the aggregate value of equities, bonds and stocks – is also up by about 20% since then, while real bond yields, on the measure calculated here, are little changed. According to the model, the rise in wealth will have boosted broad money demand by 10%. So markets may have “absorbed” about half of the additional liquidity created since end-2019, implying a smaller excess to be reflected in goods and services prices.
The implication of the model that buoyant asset prices are disinflationary is controversial – it suggests, for example, that inflation prospects would worsen if markets were to crash. That was, however, the experience following the GFC – G7 inflation rose sharply in 2010-11 after the 2008-09 collapse in asset prices. High inflation in the 1970s was associated with weak markets, with equities volatile but directionless and a trend decline in bond prices.
The suggestion that the medium-term inflation outlook has improved at the margin is based on current information and will be revised if any of the inputs discussed above change.
Medium-term inflation expectations in markets are correlated with swings in global industrial momentum – chart 3. The forecast here that the global manufacturing PMI new orders index will decline through late 2021 suggests that expectations will stabilise or moderate near term.
Chart 3

Is the inventory cycle peaking?
Some forecasters expect global industrial momentum to receive a further boost over coming months from a rebuilding of manufacturing inventories. The assessment here, by contrast, is that the growth impact of the inventory cycle is peaking, although major weakness is unlikely until next year.
The stockbuilding or inventory cycle, also known as the Kitchin cycle, has an average length of 3.5 years – more precisely, 40 months – and is a key driver of overall economic activity and market behaviour. The history of the cycle is illustrated in chart 1, showing the contribution of stockbuilding to G7 annual GDP growth.
Chart 1

The cycle bottomed in April 2020, suggesting that the next low will occur around August 2023, based on the average 40-month length. This, in turn, would imply a cycle mid-point around December 2021 – seemingly supportive of the consensus view that that the growth impact of the cycle will remain positive in H2 2021.
There are three reasons, however, to doubt this interpretation.
First, the cycle usually peaks early after deep recessions. The maximum growth contribution topped out within five quarters after the 1975, 1982 and 2009 recessions, suggesting a current peak by Q3 2021.
Secondly, the current cycle could be shorter than average to compensate for a 50-month previous cycle, which was extended by covid shock, i.e. the current cycle could compress to 30 months, implying a mid-point around July 2021.
Thirdly, cycle peaks are signalled in advance by slowdowns in global real narrow money. Six-month growth of real money peaked in July 2020, with annual growth topping in January 2021.
The view that the cycle will deliver a further significant boost is based partly on the low level of the global manufacturing PMI finished goods inventories index. However, the stocks of purchases index, covering intermediate goods and raw material inputs, is near the top of its historical range – chart 2.
Chart 2

Growth of new orders and output is related to the rate of change of stockbuilding. This is illustrated in chart 3, showing a significant correlation between the PMI new orders index and the deviation of the stocks of purchases index from a moving average.
Chart 3

This rate of change measure has already peaked and will decline further even if the stocks of purchases index maintains its current high level, as shown by the dotted line on the chart. For this not to occur, the index would have to continue to rise by 0.25 points per month, implying a move through its record high during H2.
Will the drag on new orders from a stabilisation or decline in the rate of increase of intermediate goods / raw material stocks be offset by faster accumulation of finished goods inventories? The assessment here is that the net effect will be negative, based on two considerations.
First, there has been a stronger historical correlation between new orders and the rate of change measure for intermediate goods / raw material stocks than the corresponding measure for finished goods inventories.
Secondly, the maximum correlation is contemporaneous for the former measure but incorporates a three-month shift for the finished goods inventories measure, i.e. finished goods inventories lag new orders by three months. So a rise in this measure over June-August would be consistent with a May peak in new orders.
The view here remains that the PMI new orders index will weaken through late 2021, based on the fall in global six-month real narrow money growth between July and April – chart 4. An early estimate of real money growth in May will be available later this week, assuming release of Chinese numbers.
Chart 4

Global monetary update: ongoing slowdown, China bottoming?
Additional country releases in recent days confirm that global six-month real narrow money growth fell further in April, to its slowest pace since January 2020 – see chart 1. The decline from a peak in July 2020 is the basis for the forecast here of a significant cooling of global industrial momentum during H2 2021.
Chart 1

The April fall reflected both slower nominal money growth and a further pick-up in six-month consumer price momentum – chart 2. The latter is probably at or close to a short-term peak and the central scenario here remains that real money growth will stabilise and recover into Q3. The risk is that nominal money trends continue to soften – the boost to US numbers from disbursement of stimulus payments may be over and this year’s rise in longer-term yields may act as a drag.
Chart 2

Six-month growth of real broad money and bank lending also moved down in April, with the former close to its post-GFC average and the latter considerably weaker – chart 3. Forecasts last year that government guarantee programmes would lead to a lending boom have so far proved wide of the mark; monetary financing of budget deficits, mainly by central banks, remains the key driver of broad money expansion.
Chart 3

Charts 4 and 5 shows six-month growth rates of real narrow and broad money in selected major economies. The UK remains at the top of the range on both measures, supporting optimism about near-term relative economic prospects, although slowing QE and a sharp rise in inflation promise to erode the current lead.
Chart 4

Chart 5

Eurozone real money growth, by contrast, is relatively weak: monetary deficit financing has been on a smaller scale than in the US / UK, while six-month inflation is higher than in the UK / Japan. Bank lending has been expanding at a similar pace in the Eurozone and UK. The recent step-up in ECB PEPP purchases could lift Eurozone broad money growth although the change is modest and could be offset by an increased capital outflow – see previous post.
China remains at the bottom of the ranges and monetary weakness was expected here to trigger PBoC easing by mid-year. Policy shifts usually proceed “under the radar” via money market operations and directions to state-run banks. The managed decline in three-month SHIBOR continued this week, while the corporate financing index in the Cheung Kong Graduate School of Business survey stabilised in April / May after falling over October-March, which could be a sign that banks have been instructed to increase loan supply.
The PBOC’s quarterly bankers’ survey, due for release later this month, could provide further corroboration of a policy shift: the differential between loan approval and loan demand indices leads money growth swings – chart 6. Monetary reacceleration in China remains the most likely driver of a rebound in global six-month real narrow money growth – required to support a forecast that H2 industrial cooling will represent a pause in an ongoing upswing rather than a foretaste of more significant weakness in 2022.
Chart 6

Are Fed / ECB balance sheet shifts driving EUR / USD?
Recent US dollar weakness against the euro, like the rally earlier in 2021 and a May-December 2020 slide, may reflect differential growth in net lending to government by the Fed and ECB. Fed net lending has been rising faster recently, possibly contributing to an excess supply of dollars, but the ECB may move back into the lead in H2, suggesting support for the US currency.
Eurozone balance of payments figures, available through March, show a record net outflow of direct and portfolio capital in late 2020 / early 2021. The outflow swamped the current account surplus, resulting in a record “basic balance” deficit, which may have driven a Q1 decline in EUR / USD – see chart 1.
Chart 1

Basic balance positions of currency areas, according to monetary theory, are influenced by the relative pace of domestic credit expansion (DCE), defined as bank lending to government net of government deposits plus lending to the private sector. Central banks have been a key driver of DCE in recent quarters via their QE operations and changes in their government deposit liabilities.
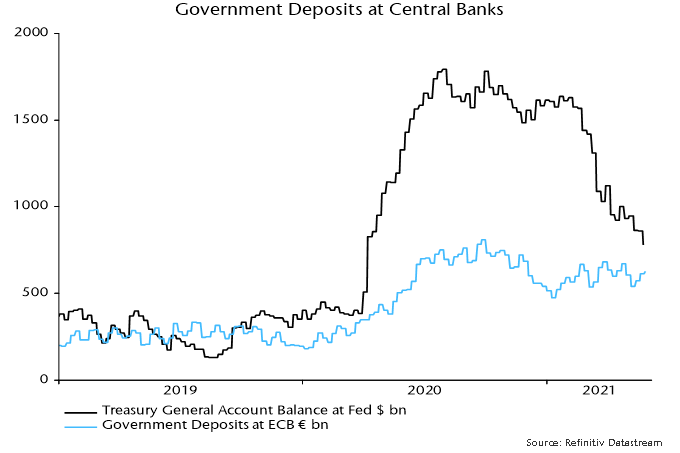
Chart 2 shows stocks of net government lending by the Fed and ECB, together with their ratio. A rise in the ratio implies faster “liquidity creation” by the Fed than the ECB, which – other things being equal – would be expected to imply upward pressure on EUR / USD.
Chart 2

There have been three distinct phases since covid struck:
- The Fed launched additional QE earlier and on a much larger scale than the ECB, resulting in a surge in the ratio in spring 2020. The dollar moved into excess supply, reflected in a sharp rise in EUR / USD into August, with a further move higher into year-end.
- The Fed’s stock of net government lending went into reverse in mid-2020 as a slowdown in QE coincided with a Treasury build-up of cash in its general account at the central bank. PEPP buying, meanwhile, boosted growth of ECB net lending. The rise in relative euro supply resulted in an outflow of Eurozone capital in late 2020 / early 2021, with associated EUR / USD weakness in Q1.
- The Fed / ECB net lending ratio rose again from January as the Treasury ran down its general account balance from more than $1.6 trn to below $800 bn currently, partly to finance $380 bn of stimulus payments over March-May. This has been reflected in a Q2 rebound in EUR / USD towards a December high of 1.23.
What next?
ECB purchases of government securities are currently running at about €110 bn per month versus Fed buying of Treasuries of $80 bn. The Treasury’s latest financing estimates assume a further fall in its balance at the Fed to $450 bn by end-July but a recovery to $750 bn by end-September. The suggestion, therefore, is that the ECB’s stock of net government lending will grow faster than the Fed’s between now and end-September.
Eurozone governments, moreover, could choose, like the Treasury, to reduce their current large cash balance with the ECB, giving an additional boost to net lending and euro supply – chart 3.
Chart 3
The Fed / ECB net lending ratio could rise further in June / July before turning down and the last three EUR / USD moves began only after a new trend had been established. H2 is looking more promising for the dollar but confirmation of a shift in relative liquidity creation is required.
