Entries from June 1, 2019 - June 30, 2019
OECD leading indicator preview: still weakening
The OECD’s G7 leading indicator is estimated to have fallen further in May, signalling that global economic weakness will extend. A tiny glimmer of hope, however, is that the rate of decline appears to be easing. This is consistent with the view here, based on monetary trends, that economic momentum will reach a low in the third quarter, though with little revival in late 2019.
The OECD will release May data for its leading indicators on 8 July but information is available for most of the components, allowing an independent calculation. The indicators are presented in ratio-to-trend form, so a stable reading signals economic expansion in line with trend, while a fall implies weak growth or outright contraction. The G7 leading indicator is estimated to have fallen for a fourteenth consecutive month in May – see chart.

The six-month rate of change, however, appears to have bottomed in February, edging higher for a third month in May. Momentum turning points in the leading indicator have preceded those in industrial output by 4-5 months on average historically. The February low, therefore, suggests that output momentum will bottom in June-July.
This is similar to the message from monetary trends: global six-month real narrow money growth bottomed in October-November 2018, suggesting a July-August low in output momentum, allowing for the historical average 9-month lead.
The “big picture” is that no recovery – in the sense of a return to trend growth – has yet been signalled by either monetary trends or the leading indicators.
Labour market watch: softer US jobs confidence
The June Conference Board consumer survey provides more evidence that economic weakness is spreading to the labour market. An indicator combining assessments of current and future job-finding difficulty rose to a 14-month high, suggesting an increase in the unemployment rate from the current 3.6% – see chart. The median projection of FOMC participants for the fourth quarter of 2019 was revised down from 3.7% to 3.6% at last week’s meeting – a likely overshoot supports expectations of rate cuts over the remainder of 2019.

Global money update: no recovery signal yet
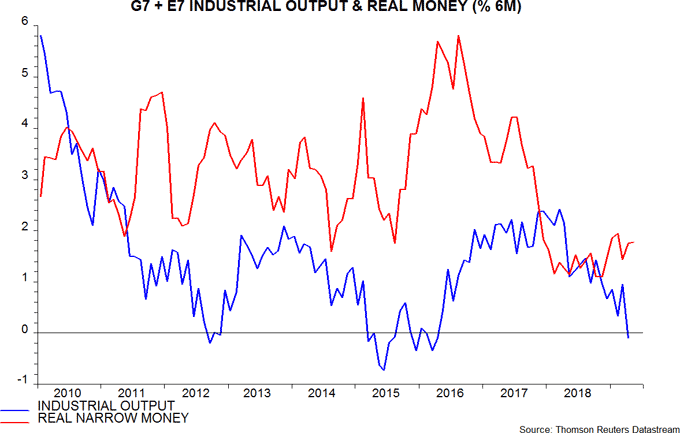
Six-month growth of global nominal narrow money appears to have risen to a 16-month high in May but an increase in inflation resulted in little change in real money expansion, which continues to languish at a low level by post-GFC standards. Global economic momentum is expected to reach a trough in the third quarter and remain weak into early 2020.
The US, Japan, China, Brazil and India have released May monetary data, together accounting for two-thirds of the G7 plus E7 aggregate tracked here. Assuming unchanged growth in other countries, six-month nominal narrow money expansion is estimated to have reached its highest level since January 2018 – see first chart. The May rise was due to firmer growth in the US, Japan and China, which offset slowdowns in Brazil and India.

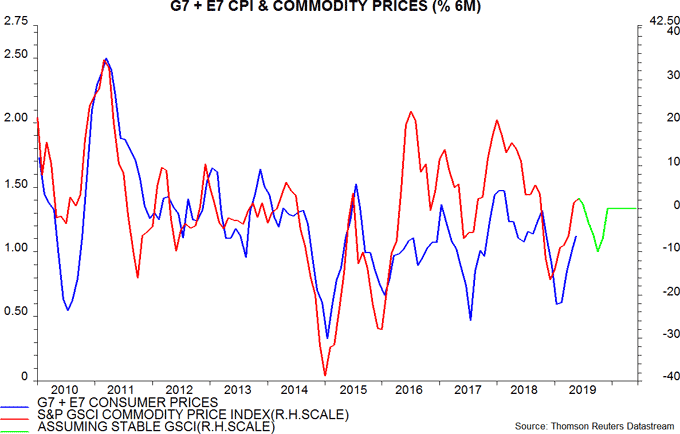
As expected, however, six-month consumer price inflation also increased further in May, reflecting a recovery in energy and other commodity prices in early 2019. Six-month real money expansion, therefore, is estimated to have been unchanged at 1.8% in May, below a recent high of 1.9% in March, though up from a low of 1.1% in October / November 2018.
Full April data confirm that the six-month change in G7 plus E7 industrial output turned negative – second chart. Based on the October / November low in real money growth, output momentum is expected to weaken further to a low around September, with limited revival into early 2020.

The judgement here remains that a rise in six-month real narrow money growth to 3% is needed to signal an economic recovery – a move through 3% occurred before all seven previous rebounds in global economic momentum since the 2008-09 recession.
An increase, on balance, appears likely. The recovery in nominal narrow money growth is hopeful and may extend in response to government bond yield declines and policy easing. Recent commodity price developments, meanwhile, suggest that inflation trends will shift from being a headwind to real money growth to a modest tailwind – third chart.

China May money / credit data: insufficient improvement
Six-month growth rates of narrow money (true M1) and broad credit (total social financing) rose in May but remain weak by historical standards – a further pick-up is needed to warrant shifting to a more optimistic view of economic prospects.

The rise in nominal money / credit growth in May was offset by an increase in six-month CPI inflation, due to surging food prices – real rates of expansion were little changed.

Suggested implications:
1. Economic data will remain weak through Q3 and, probably, Q4.
2. Further policy easing is required and likely.
3. Prospects for early 2020 are improving.
Labour market watch: US / UK weakness
Incoming news remains mostly supportive of the view here that economic weakness is spreading to labour markets.
US non-farm payrolls undershot expectations in May but the series is volatile, arguing for smoothing data over several months. Three-month growth of a three-month moving average of private payrolls fell further to the bottom of the range of recent years, with weakness confirmed by aggregate hours worked – see first chart.

Today’s UK labour market report reported a fourth successive monthly decline in May in the stock of vacancies, which leads employees in employment. The employees series recovered in April but remained below a February peak – second chart*.

A rebound in annual growth of private sector regular pay to 3.8% in April partly reflected a base effect, with three-month growth of a three-month moving average subsiding further – third chart.

Last week’s news of a further fall in the Euroland unemployment rate from 7.7% to 7.6% in April was against the global trend of softer data. The decline was driven by a drop from 14.0% to 13.8% in Spain, while rates in Germany, France and Italy were unchanged – fourth chart. As previously noted, German registered unemployment rose in May, even after adjusting for a reporting change distortion, while vacancies fell for a second month.

*Both series are reported as three-month moving averages.
Euroland relative economic prospects / BoP suggesting euro support
Euroland first-quarter GDP details released today support the view here that the Kitchin inventory cycle downswing is further advanced than in other regions – a positive for relative economic prospects.
Firms continued to increase stock levels in the first quarter but the rise, expressed as percentage of GDP, was the smallest since the fourth quarter of 2017. Stockbuilding, by contrast, increased further in the US, Japan and UK and is high by recent historical standards – see first chart.

GDP growth depends on the change in stockbuilding. The annual change has turned significantly negative, consistent with the cycle moving towards a low, while a survey-based leading indicator may be bottoming – second chart.

Euroland money trends also suggest that economic news will hold up better than elsewhere – see previous post.
An improvement in relative news could contribute to a rally in the euro, which has yet to reflect a strengthening of the basic balance of payments position* since mid-2018 – third chart.

As shown by the fourth chart, this strengthening has been driven by a cessation of net outflows on the direct and portfolio investment accounts, in turn reflecting the ending of QE – much of the liquidity previously being created by the ECB was “exported”.

Euroland / US interest rate differentials remain heavily negative but have narrowed, a trend that may continue as US economic weakness causes markets to expect more significant Fed policy easing – fifth chart. The ECB, meanwhile, may be reluctant to consider rate cuts or restarting QE before President Draghi’s successor takes the helm at end-October.

*Current account plus net direct and portfolio investment flows.

