
Entries from June 1, 2018 - June 30, 2018
UK data mixed, money trends still soft
 Simon Ward
 Post a Comment
UK monetary trends have stabilised but remain weak, suggesting continued sub-par economic expansion. The monetary slowdown has been reflected in a significant fall in nominal GDP growth, the current level of which is below that consistent with achievement of the 2% inflation target over the medium term. The view here remains that the MPC should wait for a rebound in money growth before considering a further rate hike.
Economic data released today were mixed. Quarterly GDP growth in the first quarter was revised up from 0.1% to 0.2% but the annual increase was unchanged at 1.2%, reflecting a downgrade to the third quarter of 2017.
Services output rose by 0.3% in April from March but overall GDP in April – taking into account industrial and construction data – appears to have been only 0.1% above the first-quarter level, implying a need for solid May / June data to meet the Bank of England staff projection of 0.4% quarterly growth in the second quarter.
Annual growth of nominal (i.e. current-price) GDP, meanwhile, declined further to 2.7% in the first quarter, compared with a recent peak of 4.9% in the fourth quarter of 2016. Unless potential output expansion has fallen below 1% per annum, such a growth rate, if sustained over the medium term, would imply an undershoot of the 2% inflation target.
The money measures tracked here rose respectably between April and May but their trends remain weak, arguing against an early rebound in real / nominal economic expansion.
Annual growth rates of non-financial M1 and non-financial M4 more than halved between September 2016 and April 2018 but recovered slightly in May. Three-month rates of expansion, moreover, crossed above the annual increases – see first chart.
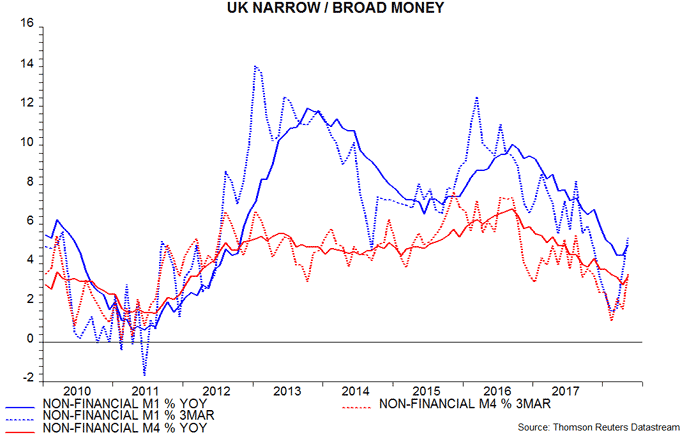
The annual growth rates remain lower than for the comparable Euroland measures, suggesting continued relative economic weakness. Non-financial M1 rose by 4.9% in the UK in the year to May versus 7.6% in Euroland; non-financial M4 grew by 3.3% versus a 3.9% increase in Euroland non-financial M3. The difference, of course, is larger in real terms, with UK consumer price inflation at 2.4% in May versus 2.0% in Euroland in June.
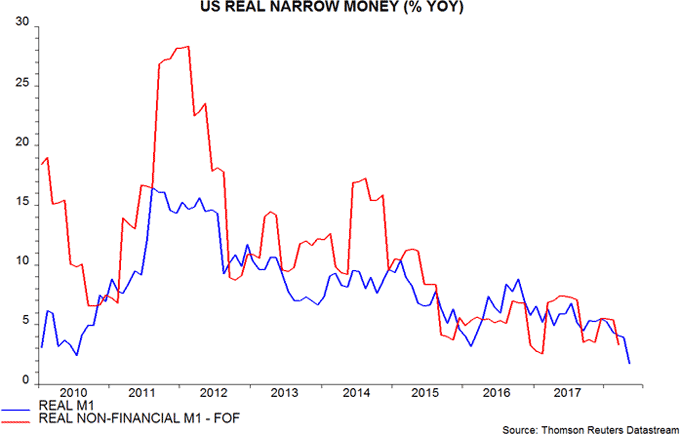
Six-month rates of change of real non-financial M1 and non-financial M4, while recovering slightly, remain well below recent and longer-term historical averages – second chart. As previously discussed, real money trends held up through November 2017 but weakened sharply after the rate hike that month, which appears to have damaged confidence and spending intentions. A mooted August follow-up increase would probably abort the recent tentative monetary recovery, risking more significant economic weakness in 2019.

Euroland money data slightly better, trends still subdued
Euroland monetary trends have stabilised, suggesting that economic growth will be sustained at its recent slower pace through late 2018. The ECB / consensus forecast that GDP will expand at a 1.75-2% annualised rate appears over-optimistic. Real narrow money growth has fallen in Italy but is only slightly lower than in the other major economies, although a further slowdown is likely.
Annual growth rates of Euroland non-financial M1 and non-financial M3 – the preferred aggregates here – fell significantly between March 2017 and March 2018 but recovered slightly in April / May. Three-month rates of expansion, moreover, have moved above the annual growth rates and are at their highest levels since October / November 2017 – see first chart.

The shorter-term reacceleration is less impressive in real terms because of a rebound in consumer price inflation. Nevertheless, six-month growth rates of real non-financial M1 / M3 have stabilised recently – second chart*.

The current six-month real growth rates are similar to those prevailing in mid-2013, following which GDP expanded at an annualised rate of 1.4% through end-2014. This seems a reasonable expectation for growth over coming quarters. The latest ECB staff projections of annual average GDP increases of 2.1% in 2018 and 1.9% in 2019, by contrast, imply sequential expansion of 1.75-2% annualised.
Narrow money trends remain similar across the “big four” economies but six-month growth of real non-financial M1 deposits is now weakest in Italy, with the recent rise in Italian yield spreads suggesting a further decline – third and fourth charts.


Corporate real M1 deposits, moreover, have slowed sharply recently in Italy and Spain, possibly reflecting a loss of business confidence and an associated reining back of expansion plans – fifth and sixth charts. The Euroland GDP slowdown to date has been driven by Germany and France but risks may now be shifting to the periphery – excluding Greece, where money measures are surging.


*Abbreviations: HH = household, NFC = non-financial corporation.
Why is US economic news holding up?
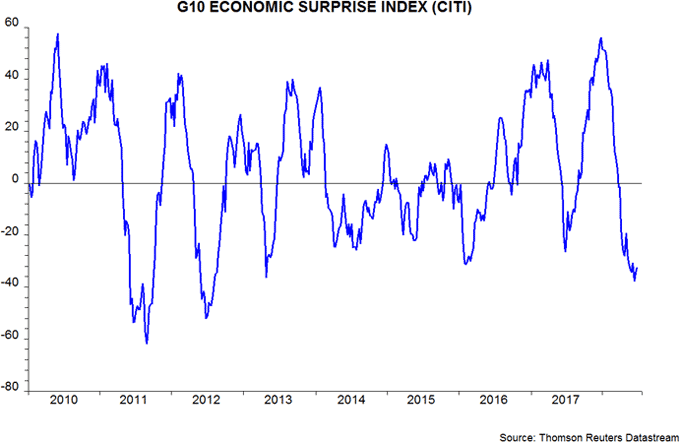
Global economic activity news has surprised negatively since March, with the Citigroup G10 composite index recently reaching its lowest level since 2012 – see first chart. This is consistent with the “monetarist” view that global economic momentum would peak in early 2018 and soften into the second half of the year.
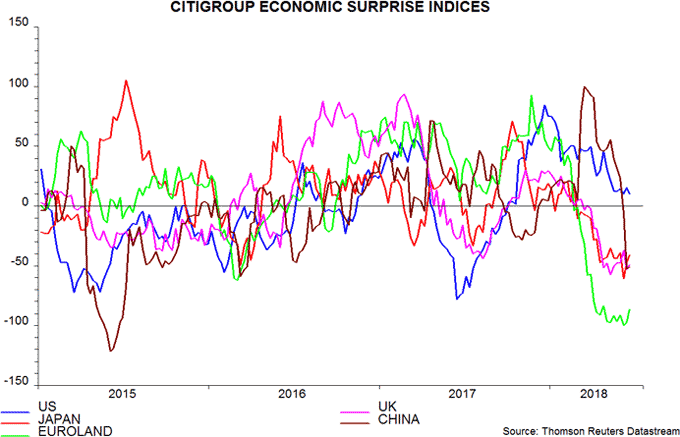
Global data weakness, however, conceals continued, though moderating, positive surprises in the US offset by very negative news elsewhere – second chart. Yet real narrow money growth – as measured by the six-month rate of change of M1 deflated by consumer prices – has been no less weak in the US than in most other major economies.
Why has US news remained resilient despite an apparently negative monetary backdrop?
An obvious answer is that fiscal stimulus has insulated the US from monetary tightness and global economic weakness. A post in December, indeed, argued – contrary to the consensus view – that US tax cuts were well-timed from a cyclical perspective, albeit reckless in terms of longer-term fiscal health.
The view here, however, was – and still is – that an effective fiscal stimulus would be signalled by a pick-up in narrow money trends. As previously discussed, such a pick-up occurred following the tax reductions in 1964, 1978 and 1981 – the three largest cuts since World War Two before the current programme (which ranks third of the four).
The explanation for the puzzle may be that US money trends have been less negative than suggested by the headline M1 data. This view is supported by additional monetary details in the Fed’s financial (flow of funds) accounts for the first quarter of 2018, released two weeks ago.
The preferred narrow money measure here for forecasting purposes is non-financial M1, comprising holdings of households and non-financial businesses. Aggregate M1 includes checkable / overnight deposits of financial institutions, fluctuations in which often reflect portfolio allocation shifts, with no economic implications.
Non-financial M1 can be calculated monthly in the Eurozone and UK, while Japanese headline money measures are non-financial by construction. In the US, by contrast, non-financial M1 is available only on a quarterly basis with a significant lag from the Fed’s financial accounts.
The third chart shows the two-quarter / six-month changes in US GDP and real M1 / non-financial M1. Turning points in real money momentum have consistently led turning points in GDP momentum in recent years. As expected, non-financial M1 appears to have given slightly more reliable signals.
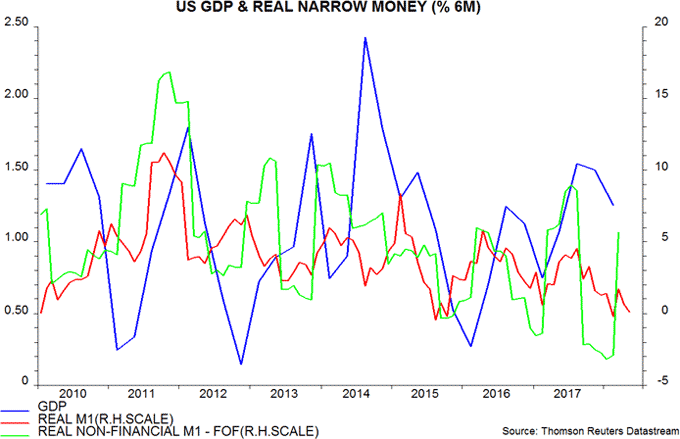
The six-month change in real non-financial M1 was weaker than that of real M1 in the second half of 2017 but rebounded sharply in the first quarter of 2018. The financial accounts show that M1 was held back by a fall in checkable deposits of financial institutions – in particular, money market funds and government sponsored enterprises (GSEs). Money funds moved funds out of banks and the repo market in order to buy Treasury bills, probably in response to attractive interest rates caused by a surge in supply, while GSEs increased their repo lending. These shifts are unlikely to carry any significance for economic prospects.
The recovery in real non-financial M1 momentum may help to explain recent US data resilience and suggests that economic growth will continue to hold up better than elsewhere near term. The judgement here, however, remains that US monetary trends are signalling a second-half slowdown, with data likely to surprise negatively relative to upbeat consensus expectations. This judgement reflects three additional considerations.
First, while the six-month change in real non-financial M1 was above that of real M1 in March, year-on-year growth rates were similar and near the bottom of the range in recent years – fourth chart.
Secondly, real M1 momentum – both six-month and year-on-year – has weakened since March. It seems likely that six-month real non-financial M1 growth has fallen back in the second quarter, although confirmation, unfortunately, will not be possible until the next financial accounts are released in early September.
Thirdly, the rebound in the six-month change in real non-financial M1 in the first quarter partly reflected a large quarterly rise in holdings of non-financial corporations, and this increase may have been connected with foreign earnings repatriation due to the tax changes. If so, it may represent a temporary rise in money demand as corporate balance sheets are reorganised, rather than signalling stronger business spending.
Global industrial activity cooling, money trends stable
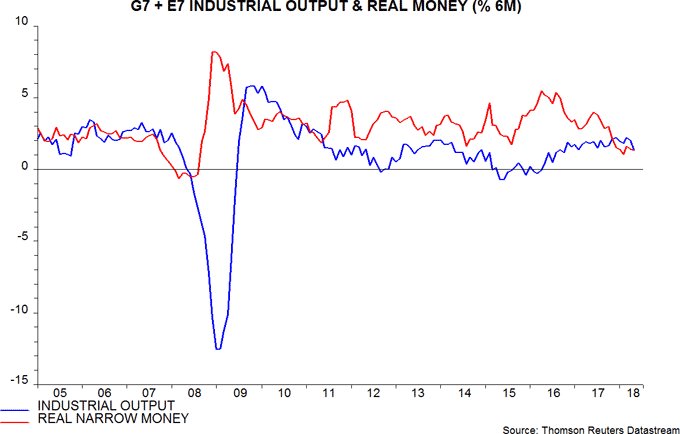
Global six-month industrial output growth appears to have fallen sharply in May, consistent with the long-standing forecast here, based on monetary trends, of an economic slowdown starting around spring 2018. Global six-month real (i.e. inflation-adjusted) narrow money growth, meanwhile, was little changed for a second month in May and slightly above the nine-year low reached in February – the monetary message is that economic prospects remain weak but have not deteriorated further.
The May estimate of global (i.e. G7 plus E7) six-month industrial output growth shown in the chart incorporates data for the US, China and Russia – together accounting for 50% of the global aggregate – and an assumed 0.25% monthly rise in other economies. The latter assumption appears reasonable and possibly optimistic based on survey and other evidence, while output in those economies would have to surge by 1.5% to prevent a fall in global six-month growth. The global measure appears to have peaked in March, consistent with a peak in real narrow money growth in June 2017, allowing for the historical-average nine-month lead.
The US, China, Japan, Brazil and India have released May monetary data, with numbers for most of the remaining countries due next week. The May estimate of global six-month real narrow money growth in the chart extrapolates recent nominal monetary trends in missing countries while incorporating near-complete consumer price data.
The February low in real money growth suggests that industrial output growth will continue to decline into around November 2018.
Monetary trends, it should be emphasised, are signalling a slowdown, not a recession. Six-month real narrow money growth bottomed well above zero. Real money contracted before the six global recessions since 1970.
The lack of a significant recovery to date in real money growth suggests that global economic momentum will remain soft into early 2019.
Chinese economy slowing, signals mixed
Chinese monetary trends remain worrying but non-monetary leading indicators are giving a more hopeful message for economic prospects. A further slowdown is expected over the remainder of 2018 but weakness may be contained.
The forecasting approach followed here uses non-monetary leading indicators – usefully summarised by the OECD’s composite measures – to cross-check the message from monetary trends. In China’s case, the signals currently conflict, reducing confidence in the forecast.
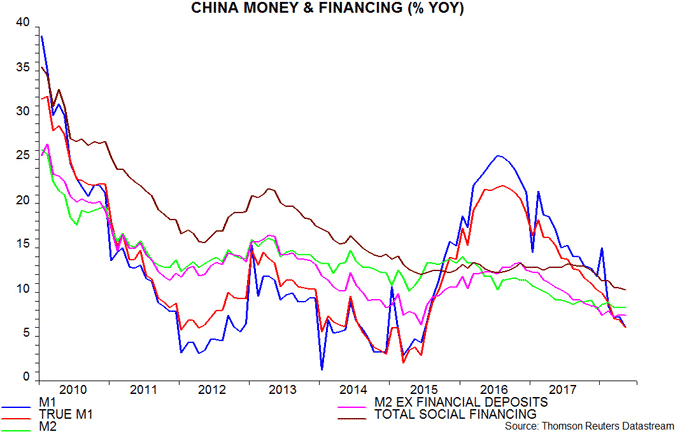
Monetary trends are unambiguously weak. Annual growth of the official M1 measure fell further to 6.0% in May, the least since 2015, while M2 growth was stable at 8.3%, just above December’s record-low 8.1%. The alternative money measures preferred here were similarly soft, as was the “total social financing” credit measure – see first chart.
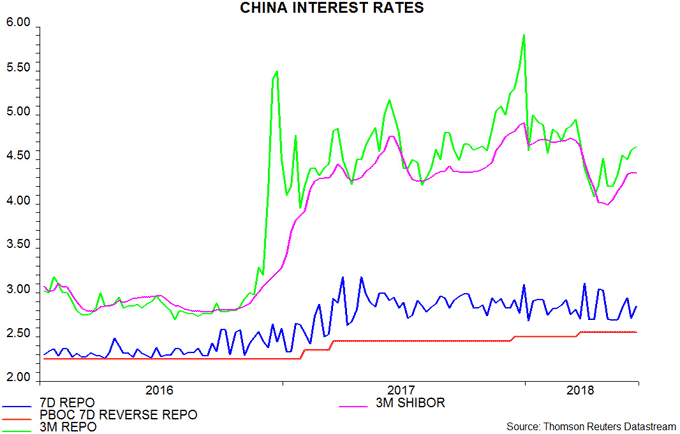
Previous posts suggested that monetary trends would revive in response to an apparent policy reversal towards easing in April, reflected in a sharp fall in term money market rates, although the timing and extent of a recovery were uncertain. The May money and credit data indicate that the policy shift has yet to gain traction, while money rates have recently partially retraced their decline – second chart.
Activity news for May released today appears, on the surface, to be consistent with the negative message from money trends. Annual growth rates of industrial output, retail sales and fixed asset investment fell from April and undershot consensus estimates. Investment growth weakened particularly sharply – third chart.
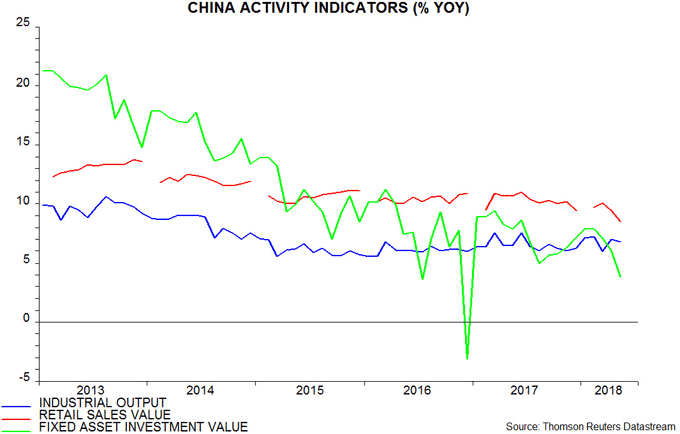
Some details of the reports, however, jar with a negative interpretation. Annual growth of housing sales and starts rose smartly – fourth chart. Steel production was also notably strong. The sharp fall in investment growth, meanwhile, reflected weakness in infrastructure spending, with private capex expansion only slightly lower.

The OECD’s Chinese composite leading indicator, meanwhile, rose for a second month in April, according to data released yesterday – fifth chart. The six components of the indicator are: steel production, motor vehicle production, building completions, production of chemical fertilisers, the export orders balance from the PBoC’s quarterly 5000 enterprise survey and stock market turnover. New data for the first three components released today imply a positive contribution to the indicator reading for May, according to our calculations.
The decline in the leading indicator into February suggests an economic slowdown through late 2018, consistent with the message from monetary trends. Prospects further out are cloudy but a pessimistic bias will be retained here pending a revival in money trends.
Is the MSCI EM index fit for purpose?
The characteristics of the MSCI emerging markets (EM) equities index have changed significantly in recent decades, raising questions about its suitability as a benchmark for EM investing.
The index is now dominated by China, the weight of which rose to 33.2% on 1 June following the addition at end-May of more than 200 A shares with an inclusion factor of 2.5% of their market capitalisation.
China’s weight on 1 June, surprisingly, was not the largest single-country weight in the history of the index – Malaysia’s weight was 33.8% at the inception of the index on 1 January 1988, when there were only 10 country constituents, compared with the current 24 – see first chart.

The largest single-country weight, however, has averaged 20.5% over the 30-year history of the index – well below the current Chinese level. China’s weight, moreover, is likely to increase further – the A share factor is scheduled to rise to 5% at end-August, while it is reasonable to assume full inclusion within 10 years. (The phased inclusion of Korea and Taiwan in the 1990s / 2000s occurred over seven and nine years respectively.) MSCI previously estimated that China would account for about 42% of the index if the A shares were included fully, based on then-prevailing market capitalisations.
The rise of China has resulted in the index providing less regional diversification. At end-1999, Europe, the Middle East and Africa (EMEA) accounted for 31.5% of the index, with Latin America at 28.2%. The weights on 1 June were 13.9% and 10.6% respectively, with Asia up to 75.5%. Asia’s weight could exceed 80% if / when the Chinese A shares are fully included – second chart.

The index has also become less “emerging”. The third chart shows the relative income levels of the EM index (a market capitalisation-weighted average of the constituent countries) and selected countries. Relative income is measured by GDP per capita at purchasing power parity expressed as a percentage of the G7 level. At its inception in 1988, the index represented countries with an average income of about one-third of the G7 level. That proportion has risen to about a half, mainly reflecting the inclusion and rapid growth of Korea and Taiwan. Taiwan’s GDP per capita is now close to the G7 average while Korea’s is within the G7 range. From an economic perspective, neither country should be represented in an EM index.

Investors, arguably, should now allocate to Korea and Taiwan within the developed markets portion of their equity portfolio. Removing them from the EM benchmark, however, would further magnify China’s dominance. There is a case for separating out China, to reflect its size and unique economic characteristics, and to make explicit the allocation decision between China and the rest of EM – in the same way that investors often separate a developed markets portfolio into US and “international” buckets.
Stripping China, Korea and Taiwan from the MSCI EM index would create a benchmark with similar characteristics to the “old” EM index: GDP per capita of the benchmark constituents would be less than 40% of the G7 level – third chart – while the weights of EMEA and Latin America would be much closer to that of Asia – fourth chart.

