Entries from July 1, 2019 - July 31, 2019
US profits revision suggesting weaker outlook
 Simon Ward
 Post a Comment
The big news in last week’s US GDP release was a huge downward revision to corporate profits growth in recent years.
The national accounts measure of post-tax “economic” profits – adjusted for stock appreciation and to reflect “true” depreciation of capital assets – was revised down from $2,031 billion to $1,855 billion for 2018, a cut of 8.7%. Profits in Q1 2019 were unchanged from Q3 2014 – see first chart.
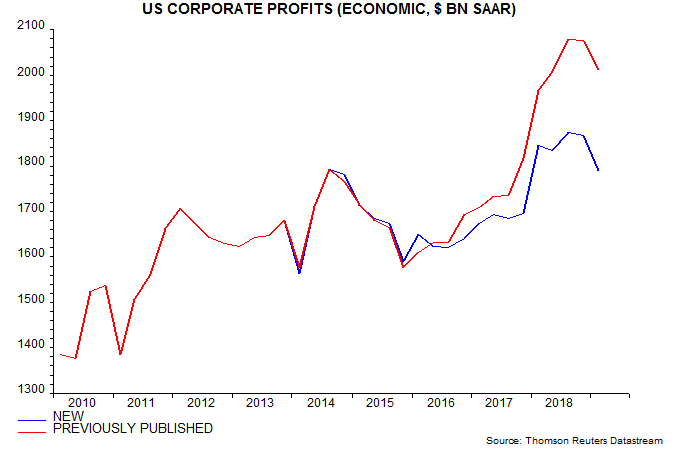
The downward revision reflected the incorporation of comprehensive annual data from corporate tax returns. The cut in profits was balanced by upward revisions to employee compensation and net interest costs.
Last year, some analysts cited strong growth of national accounts profits as a reason for economic optimism. A post at the time warned that early national accounts numbers were often revised significantly. Real-time profits were rising immediately ahead of the last two recessions but the numbers were subsequently revised to show falls.
The business sector was previously reported to be a net lender to the rest of the economy in Q1 2019, with saving exceeding investment by 0.9% of GDP. The new data show a deficit of 0.8% of GDP – second chart. This excludes borrowing to finance net equity retirement – 3.5% of GDP in Q1.
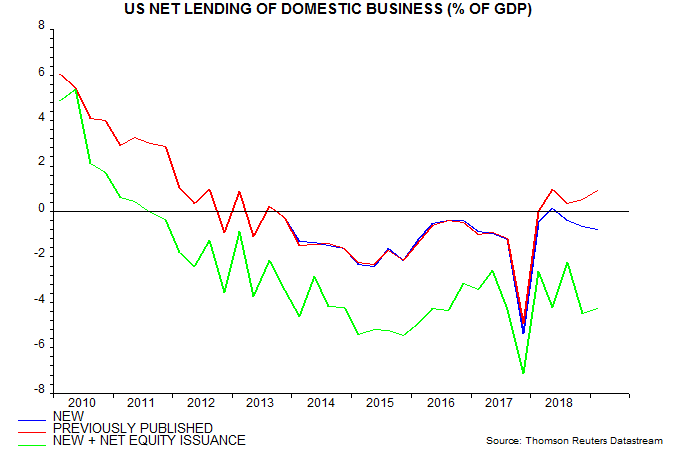
The weaker financial position than previously reported supports the pessimistic view here of prospects for business investment and employment.
The new national accounts profits numbers show a marked divergence from S&P 500 operating earnings. The latter rose by 57% from a low in Q4 2015 through Q1 2019 versus an increase of only 13% in the national accounts series – third chart.
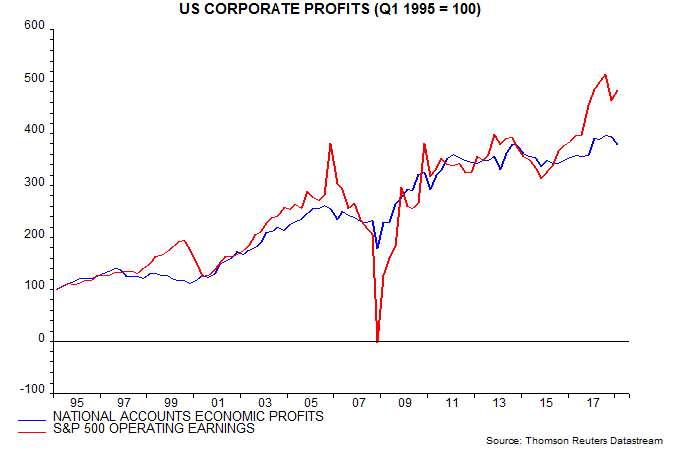
One reason for the difference is that the national accounts series encompasses smaller and unquoted companies – S&P 500 operating earnings are equivalent to about two-thirds of the national accounts total. Profits of these smaller firms may have been underperforming.
The national accounts series measures income from current production, excluding non-recurring items such as capital gains / losses, restructuring charges and bad debt provisions. While the definition of operating earnings is similar, the adjustments made by S&P may be less comprehensive and rely on data provided by companies in their financial statements rather than tax returns.
A similar large divergence between S&P 500 operating earnings strength and stagnant or falling national accounts (revised) profits occurred ahead of the 2001 and 2008-09 recessions and was “resolved” by a subsequent decline in S&P earnings.
Euroland PMI weak but money trends still hopeful
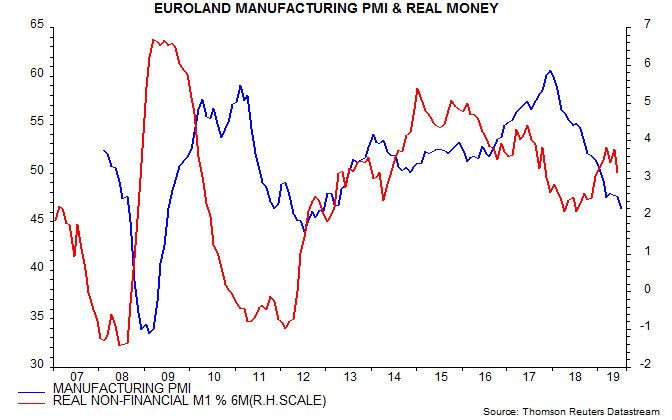
The Euroland manufacturing PMI fell further in July but the view here remains that the index is bottoming, based on the leading signal from a rise in six-month real narrow money growth since late 2018 – see first chart.
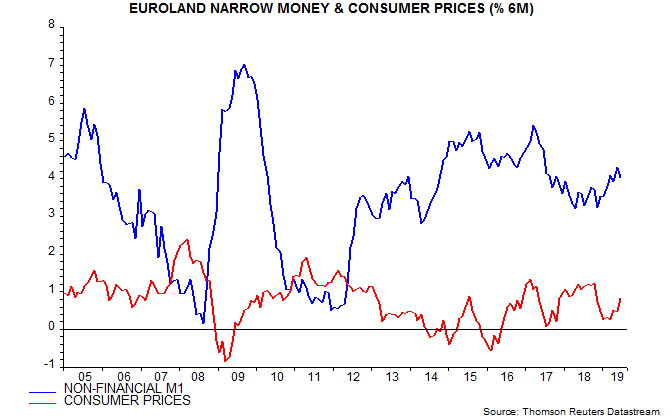
Real money growth, admittedly, slipped back in June (data also released today) but this mainly reflected a further pick-up in six-month inflation, which is probably peaking – second chart. Nominal narrow money growth has moved sideways recently.
Real narrow money growth remains stronger than in other major economies.
The further fall in the PMI may have been driven by firms paring excess inventories, resulting in a reduction in orders on suppliers. Orders will normalise higher when this process ends – even with unchanged final demand. This could be imminent: the ratio of new orders to inventories remained above its recent low in July despite the further decline in orders.
While industrial momentum could be bottoming, the latest money numbers suggest a subdued economic outlook, implying softer labour markets and a continued inflation undershoot. The composite PMI, moreover, could decline further as services catch up with manufacturing weakness.
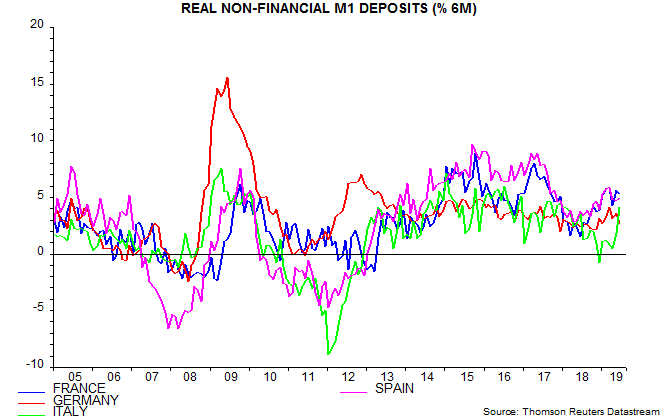
Country data show that real narrow money growth remains stronger in France and Spain than Germany, suggesting superior economic prospects – third chart. A sharp rise in Italian growth in June mainly reflected a positive base effect and should unwind next month.
US C&I loans confirming inventory downswing
Three-month growth of US commercial bank loans and leases fell from 1.5% (6.3% annualised) in February to 0.9% (3.5%) in June, reflecting a sharp slowdown in commercial and industrial (C&I) lending – see first chart.

The demand for C&I loans is closely related to the stockbuilding or inventory cycle. The lending slowdown adds to other evidence, discussed in Friday’s post, that the US / global cycle is weakening rapidly towards a low likely to be reached during the second half of the year.
The second chart shows the contribution of stockbuilding to annual GDP growth together with the annual change in three-month growth of C&I loans. The relationship suggests that the change in inventories will be a significant drag on Q2 GDP, to be released on Friday.

The Q2 report will incorporate annual revisions, which may resolve the recent large divergence between the headline (expenditure) and income measures of GDP. According to current data, headline GDP rose at a 2.6% annualised rate in the fourth and first quarters combined versus growth of only 0.8% in the income measure – the latter weakness is consistent with a stagnation of real narrow money in the year to November 2018.
Global economic update: beware "false dawn" PMI bounce
As discussed in Tuesday’s post, global narrow money trends suggest that economic momentum will bottom out in the third quarter of 2019 but remain weak into early 2020.
The monetary signal has been confirmed by a global non-monetary leading indicator based on the OECD’s country leading indicators. The six-month rate of change of this indicator appears to have bottomed in early 2019 and typically leads by 4-5 months – see first chart.

Neither money trends nor the leading indicator are yet suggesting an economic recovery, in the sense of a return to trend growth.
A further reason for expecting economic momentum to bottom out around the third quarter, discussed in previous posts, relates to the global stockbuilding or inventory cycle, which averages 3.5 years in length, i.e. measured from trough to trough.
The second chart shows the contribution of stockbuilding to annual G7 GDP growth. The last trough occurred in the first quarter of 2016, suggesting another low in the third quarter of 2019, assuming that the current cycle is of average length.

The growth contribution was still significantly positive in the first quarter of 2019 – the last data point in the chart – raising the possibility that the current cycle will be longer than average, implying a later trough.
However, two pieces of evidence suggest a rapid weakening in recent months – a third-quarter low, in other words, remains plausible.
First, an indicator derived from G7 business survey responses about inventories correlates with the GDP stockbuilding data but is more timely and sometimes leads, and this indicator turned significantly negative in early 2019, though has yet to reach an extreme suggestive of a cycle low – third chart.

Secondly, global retail sales volumes have rebounded strongly since end-2018, far outpacing industrial output – fourth chart. This suggests a significant drawdown in inventories unless spending on capital goods has collapsed.

Retail sales strength is likely to fizzle. It partly reflects a US bounce-back after weakness associated with the government shutdown. In addition, a fall in sequential inflation was a tailwind during the first half but is now reversing. Softening labour markets, meanwhile, are starting to erode consumer confidence.
The forecast of a trough in global industrial momentum in the third quarter suggests that the global manufacturing PMI – a coincident indicator – is at or near a low. The forthcoming July flash results, moreover, could reflect some hope engendered by the Trump-Xi trade truce in late June – this may have influenced yesterday’s stronger Philadelphia Fed manufacturing survey.
The danger is that markets and policy-makers wrongly interpret a bottoming of the manufacturing PMI as a precursor to an economic recovery in late 2019 / early 2019 – ignoring evidence from monetary trends and other leading indicators that prospects remain worryingly weak.
A rebound in bond yields as expectations of central bank policy easing are reined back would risk aborting the recent tentative monetary recovery. It could also trigger another sell-off in equities, which have displayed a strong inverse correlation with real yields in recent months – fifth chart.

Labour market watch: ominous UK vacancies fall
The stock of vacancies – a leading indicator of the number of employees – peaked in January (three-month moving average basis), with another hefty fall in June. Employee numbers appear to have peaked in February (also three-month moving average) – see first chart. A stable unemployment rate of 3.8% reflects slower labour force expansion and a rise in “self-employment”, which have – so far – balanced the stall in employees.

Vacancies are down by 3.9% from the January peak but the fall has been cushioned by a rise in public sector openings: the decline outside public administration, education and health was 6.8% – second chart.

Manufacturing vacancies have plunged 12.5% since January. Other large declines include real estate and “other service activities” (-20%), information and communication (-13%), arts, entertainment and recreation (-9%), financial and insurance activities (-8%) and construction (-7%).
By size of business, the decline has been concentrated among firms with fewer than 50 employees – vacancies for this group are down by 9.6% versus 1.7% for larger employers.
Global money update: signal still downbeat
Global money trends still aren’t signalling an economic recovery.
Six-month growth of real narrow money in the G7 economies and seven large emerging economies is estimated to have edged up to 1.9% (not annualised) in June but remains well below a post-GFC average of 3.2% (i.e. calculated over 2010-18) – see first chart. A rise to this level is probably needed to signal an economic recovery, in the sense of a return to trend expansion.

The June increase in real money growth was driven by China – second chart. US growth remains weak and there was a sharp slowdown in Japan, partly inflation-driven. The final June figure will depend importantly on Euroland and UK monetary data, to be released on 24 and 29 July respectively.
The implication that global economic growth will remain below trend at least through early 2020 suggests a coming rise in unemployment, with attendant additional pressure for central bank policy easing.
The forecast of an unemployment turn is supported by G7 consumer surveys: the net percentage of consumers expressing a negative view of labour market conditions rose to a 21-month high in June – third chart.