Entries from July 1, 2017 - July 31, 2017
UK inflation: temporary reprieve
UK CPI inflation surprised on the upside in May and on the downside in June. The “big picture” is that it is above the MPC’s forecast and will probably still reach 3.0% later in 2017, despite lower-than-expected energy prices.
Annual CPI inflation fell from 2.9% (2.87% before rounding) in May to 2.6% (2.64%) in June. Lower motor fuels inflation accounted for 11 basis points of the decline (i.e. about half) with the remainder due to “core” components.
CPI inflation averaged 2.74% in the second quarter, above the MPC’s forecasts of 2.65% and 2.43% in the May and February Inflation Reports respectively. The overshoot would have been larger but for a lower crude oil price than the MPC assumed.
Reasons for expecting inflation to reach 3.0% later in 2017 include:
1) Despite a slower monthly gain in June, core* prices rose at a seasonally adjusted annualised rate of 3.0% in the latest three months from the previous three – see first chart. Annual core inflation of 2.4% in June would rise to 2.9% in October if this pace of increase were to be sustained.
2) Annual core** producer output price inflation rose to 2.9% in June and usually peaks ahead of core CPI inflation, i.e. it also suggests a further increase in the core CPI rate – second chart.
3) The headline / core gap is likely to remain positive and may widen, reflecting stronger food price inflation and a stabilisation of energy inflation after a recent slowdown (assuming stable crude energy costs). CPI food inflation rose further to 2.6% in June but is significantly lower than would be expected based on historical relationships with producer output price inflation for food products (5.8% in June) and the annual increase in the FAO’s global food commodity price index, expressed in sterling (19% in June, down from a peak of 36% in January) – third chart.
*Excluding energy, food, alcohol, tobacco and education, and adjusted for the estimated impact of VAT changes.
**Excluding food, beverages, tobacco and petroleum.
Chinese money trends still expansionary
A fall in Chinese money growth since late 2016 has been reflected in an easing of inflationary pressures rather than a loss of economic momentum. Current monetary trends are judged here to remain consistent with respectable economic expansion, while the PBoC has started to reverse recent policy tightening, which may prevent a further slowdown.
Annual growth of real GDP was 6.9% in the second quarter, unchanged from the first quarter and above the consensus forecast of 6.8%. Nominal GDP growth fell from 11.8% to 11.1%, reflecting a slowdown in the price deflator – see first chart.
The decline in nominal expansion is consistent with an earlier fall in annual narrow money growth, as measured by “true” M1*, from a peak in August 2016. This eased further to 13.9% in June but is much stronger than in 2014 / early 2015, when the economy was at risk of serious weakness / deflation – second chart.
Similarly, broad money growth, as measured by M2 excluding financial sector deposits**, fell to 10.3% in June but has retraced less than half of its rise between mid-2015 and late 2016 – third chart.
The transmission of slower money expansion to prices rather than activity is highlighted by producer price / industrial output data. Six-month PPI inflation eased from 5.8% in February to 0.7% in June, while six-month industrial output growth rose to 4.7% in June, a 42-month high – fourth chart.
A further monetary slowdown would raise the risk of economic damage but easing inflation and currency stability have allowed the PBoC to start reversing first-half policy tightening. Three-month SHIBOR has fallen back to its April level, although seasonal factors may also have played a role – fifth chart.
A constructive economic view will be maintained here barring a further decline in money growth. External risks may be more significant – a change in US trade policy and / or a strong rebound US economic growth later in 2017, resulting in upward pressure on US rates / the dollar and a reacceleration of Chinese capital outflows.
*True M1 = currency in circulation plus corporate / household demand deposits. The official M1 measure includes only corporate deposits.
**Financial sector deposits are volatile and contain little information about future spending on goods and services. Such deposits surged in 2014-15 but have stagnated in 2016-17, i.e. they gave a significant boost to M2 growth in 2014-15 but are now exerting a drag.
US ISM strength: signal or "head fake"?
A rise in the US ISM manufacturing purchasing managers’ index to a 34-month high in June, reported last week, presents a challenge to the view here that global economic momentum peaked in spring 2017 and will moderate into the fourth quarter. The ISM PMI is widely regarded as a reliable gauge of global as well US industrial activity; indeed, it exhibits a slightly higher correlation with global than US industrial output growth*.
A provisional judgement is that the ISM surge is a reflection of earlier economic strength and will be swiftly reversed. This is supported by three observations.
First, the forward-looking new orders component of the PMI, while rising sharply in June, remained below its level in February / March.
Secondly, the ISM surge is at odds with the Conference Board CEO confidence survey for the second quarter, also released last week, which reported weaker business expectations among manufacturers. The CEO expectations measure usually aligns with the trend in ISM new orders – see first chart.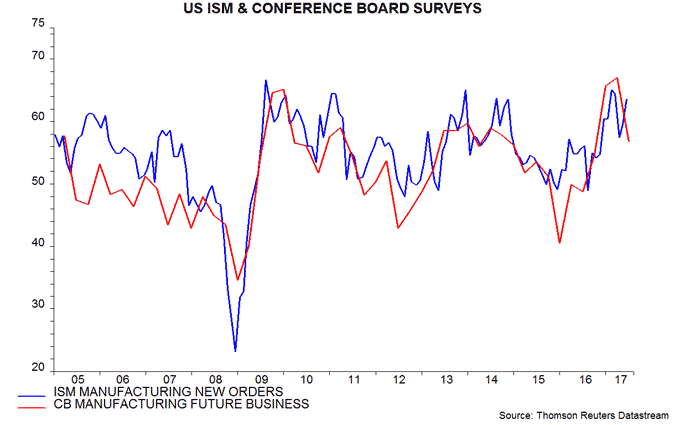
Thirdly, the ISM result also contrasts with a fall in the IBES US equity analysts’ earnings revisions ratio in June, to an 11-month low. A rise in the revisions ratio in May had suggested that ISM new orders would rebound in June – second chart.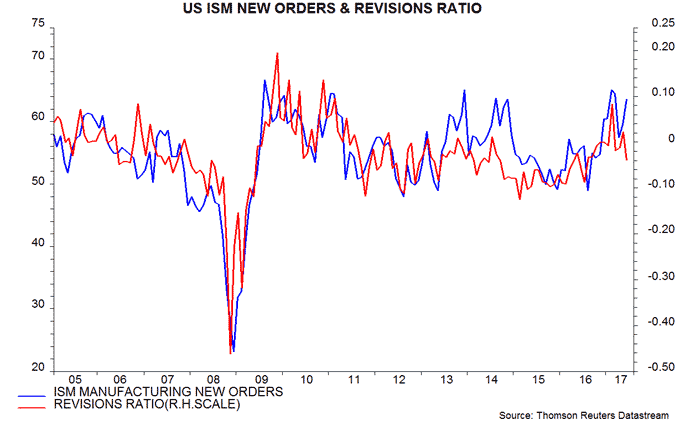
As previously discussed, the global slowdown is expected to be modest and temporary, with money trends now signalling economic reacceleration in late 2017. Near-term negative economic surprises may focus on Euroland, partly reflecting consensus over-optimism.
*Contemporaneous correlation with six-month industrial output growth over 1996-2016: global (i.e. G7 plus E7) +0.77, US +0.71.
UK labour market strength adds to pressure on MPC
The UK labour market tightened further last quarter, consistent with the view here that the economy has retained momentum and strengthening the case for a “pre-emptive” rise in interest rates, despite continued subdued pay growth.
The unemployment rate fell to 4.5% over March-May, below the MPC’s forecast of 4.7% for the second quarter in the May Inflation Report and the lowest since 1975. The single-month estimate for May was 4.4%.
The unemployment rate understated labour market slack earlier in the upswing, because there were unusually large numbers of people either working part-time involuntarily or not actively seeking employment, despite wanting a job. This “hidden” margin has eroded rapidly since 2014. A broader measure* of labour underutilisation (i.e. a UK equivalent of the US U-6 rate) fell further to 12.9% over March-May, close to a 2005 low of 12.5% in the last economic upswing – see first chart. The gap between the underutilisation and unemployment rates is the smallest since 2008.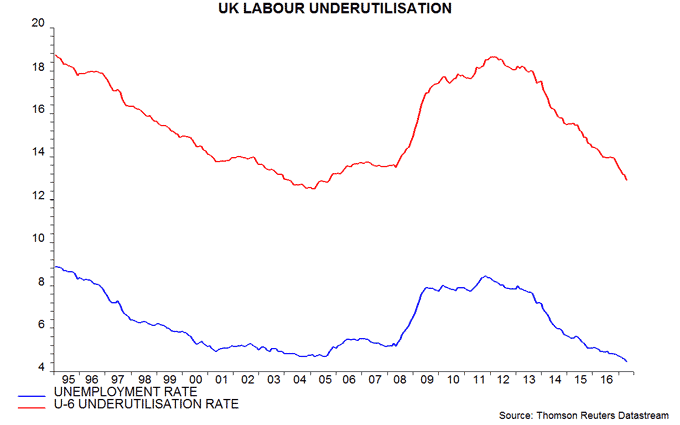
Annual growth of average weekly earnings, including bonuses, weakened further to 1.8% over March-May, the lowest since 2014. Regular earnings growth, however, ticked up to 2.0%. Private-sector regular growth was 2.2% over March-May and 2.4% in May alone, a five-month high.
While overall pay trends remain subdued, the MPC’s assessment will also take into account recent weaker-than-expected productivity performance, faster growth of non-wage labour costs and a possible lifting of the 1% cap on public-sector pay increases.
Annual growth in aggregate weekly earnings (i.e. average earnings multiplied by the number of employees) was unchanged at 3.1% over March-May, supported by a further rise in employment expansion to 1.3%, a 10-month high – second chart. Aggregate earnings, therefore, are currently still just outpacing consumer prices – a contrast with the last inflation upsurge over 2009-11, when earnings lagged significantly.
*Total unemployed plus number working part-time because could not find full-time job plus number inactive but wanting a job, expressed as % of labour force plus number inactive but wanting a job.
More caveats to UK consensus economic gloom
UK monetary trends signal that economic prospects have deteriorated but consensus gloom may have become exaggerated again.
Economists now expect the preliminary second-quarter GDP release on 26 July to report quarterly growth of only 0.2-0.3%. This partly reflects weak industrial and construction output data for May – the average levels of output in April / May were 0.5% and 1.6% respectively below their first-quarter averages.
Services output in April, however, was 0.4% above the first-quarter average and turnover data – ignored by most economists – suggest a respectable monthly increase in May. The official GDP estimate is likely to incorporate a projection of further growth in June. Services output, therefore, may be reported to have risen by 0.6% last quarter. With the sector accounting for 79% of GDP, this would suggest overall growth of 0.4% despite industrial / construction weakness – in line with the Bank of England staff’s estimate at the time of the June MPC meeting.
Gloom about consumer spending prospects was magnified by news of a fall in the household saving ratio to a record low. As previously discussed, however, the official saving ratio measure is at odds with other data indicating respectable household accumulation of financial and capital assets.
The official approach measures saving as the difference between disposable income and consumption. An alternative approach is to measure it as new investment in financial and capital assets minus borrowing. Based on the alternative approach, the saving ratio was 7.2% in the year to the first quarter versus only 4.2% for the official measure – see first chart.
The two measures are conceptually equivalent so the difference must reflect measurement error. One possibility is that the official statistics understate income, perhaps reflecting the increasing difficulty of tracking compensation as working patterns change.
According to the official data, household real disposable income fell by 1.4% in the year to the first quarter. The June EU Commission consumer survey, by contrast, reported that a balance of only 2.3% of households judged their finances to have deteriorated over the past 12 months – significantly better than the long-run average (since 1990) of 8.5%.
Pessimistic forecasters argue that a consumer slowdown will be compounded by weakness in business investment. Real* disposable income of private non-financial corporations (PNFCs), however, rose by 20.6% in the year to the first quarter, following a decline in late 2015 / early 2016 – second chart. This pick-up accords with recent stronger corporate money trends, suggesting that a first-quarter recovery in investment will be sustained.
*Real = deflated by GDP deflator.
A "monetarist" perspective on current equity markets
Global monetary trends suggest that economic growth will slow over the summer / autumn before strengthening again in late 2017. Major central banks are likely to proceed with plans for stimulus withdrawal despite weaker near-term momentum, reflecting concern about stretched labour markets. Stronger growth later in 2017 may accelerate policy tightening. Equity markets are at risk from earnings disappointments and / or rising rates. Relative money trends suggest adding US and Japanese exposure at the expense of Europe and emerging markets.
Previous commentaries argued that global economic momentum would slow from a peak in spring 2017. Recent news is consistent with this forecast. Six-month growth of industrial output in the G7 developed economies and seven large emerging economies (the “E7”) reached a three-year high in April before falling in May. J P Morgan’s global manufacturing purchasing managers’ index has eased back from a February / March peak. Citigroup’s G10 economic surprise index, meanwhile, turned negative in June, having been strongly positive earlier in 2017.
The basis for the forecast was a fall in G7 plus E7 real narrow money* growth from a peak in August 2016 – monetary trends lead the economy by about nine months on average. The decline was exaggerated by India’s “demonetisation” programme but an adjusted** real money growth measure also declined significantly – see first chart. The slowdown signal from monetary trends was subsequently confirmed by a shorter-term global leading indicator derived from the OECD’s country leading indicators – second chart.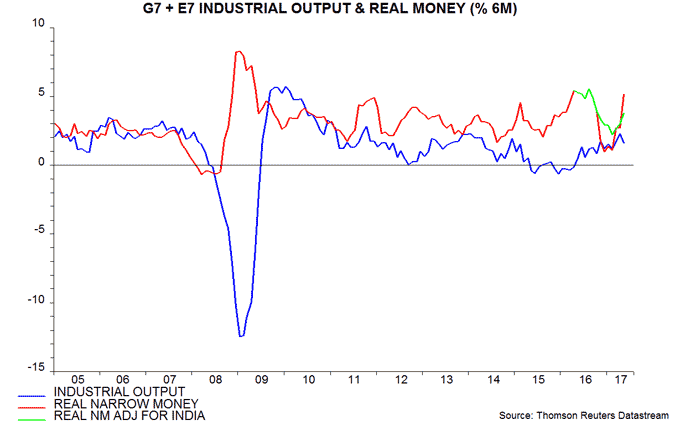
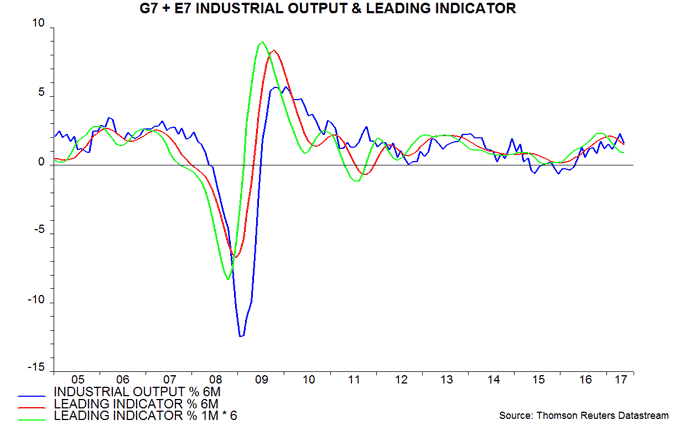
Adjusted real narrow money growth, however, reached a low in February 2017, recovering solidly through May. Allowing for the average nine-month lead, this suggests a revival in economic momentum in late 2017 / early 2018. Confidence in such a scenario will increase if growth of the leading indicator bottoms out over the summer – its average lead time is about four months, i.e. turning points typically lag those for real money by about five months.
The suggested economic scenario is potentially negative for equity markets. Slower near-term growth would probably be associated with earnings undershooting forecasts – the MSCI All-Country World revisions ratio, indeed, turned negative in June, following a seven-month positive run. Major central banks, however, are focused on inflationary risks from stretched labour markets and would be likely to play down a modest weakening of activity data. The G7 unemployment rate fell to 5.1% in May, the lowest since 1980. A growth revival in late 2017, meanwhile, could trigger faster policy tightening.
The third chart shows that a rebound in US real money growth has been a key driver of the rise in the global measure. Canadian and Japanese trends have also improved, while Chinese growth has stabilised after a significant decline. 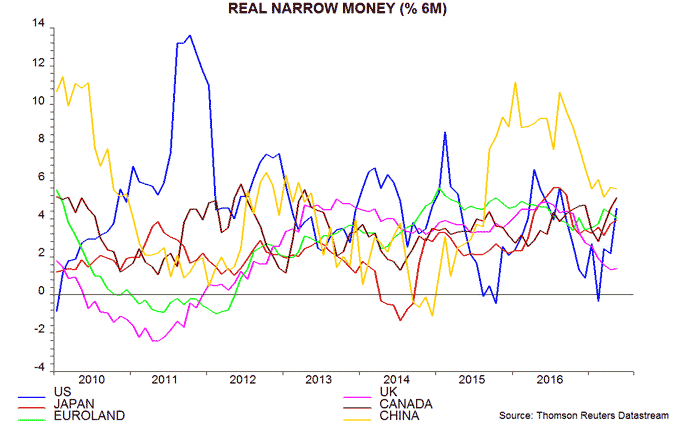
Why has US money growth recovered despite Fed rate hikes? One explanation relates to a change in money market fund regulations in 2016. The immediate impact of this change was to encourage a switch in the assets of money funds out of bank deposits and commercial paper into Treasury securities. This shift pushed up banks’ funding costs, with a negative effect on lending and money growth. The three-month LIBOR / Treasury bill yield spread rose from 24 bp in November 2015 to a peak of 55 bp in September 2016.
The portfolio shift, however, appears to have been completed by late 2016. The LIBOR / T bill spread was back at 25 bp in June 2017. Easier funding conditions may have offset the negative impact on money / credit trends of Fed policy tightening. Bank lending as well as narrow money has picked up since early 2017. This explanation suggests that the regulatory change was a headwind for the economy and policy rates in 2016 but is now acting as a tailwind.
Chinese economic growth may hold up during the second half despite recent softer money / credit trends. Real money growth remains at a respectable level – third chart. The earlier monetary surge was reflected in a pick-up in inflationary pressures rather than a significantly stronger economy – fourth chart. The monetary slowdown, similarly, appears to be mainly affecting price momentum – producer prices have stabilised after surging in late 2016 / early 2017. Falling inflation gives the PBoC scope to reverse recent policy tightening to support growth, if necessary.
Strong Euroland business surveys have encouraged hopes that economic growth is ratcheting higher. Monetary trends, however, remain stable, suggesting that GDP will expand at around its recent pace (1.9% in the year to the first quarter of 2017). Surveys may have been boosted by a temporary “Macron effect”. Unemployment continues to fall rapidly and is on course to reach estimates of the “equilibrium” rate in 2018. The Fed was wrapping up QE at the equivalent US stage in 2014. The ECB may accelerate plans for stimulus withdrawal during the second half.
Recent rises in US and Japanese real money growth, coupled with possibly excessive optimism about Euroland economic prospects and weak UK money trends, suggest increasing US / Japanese equity market exposure at the expense of Europe. The US, in addition, would probably outperform in a general pull-back, while official buying might support Japanese stocks. The BoJ remains the most dovish of the major central banks, though may be forced to lift the zero yield cap during the second half if global yields climb.
Real money growth in the E7 emerging economies moved above the G7 level in late 2015, arguing that relative economic and equity market prospects were improving. Adjusted for the Indian demonetisation distortion, the E7 / G7 gap remained positive until recently – fifth chart. Emerging market equities could struggle in a market pull-back or if a stronger US economy forces the Fed to accelerate tightening, a scenario that would probably be associated with upward pressure on the US dollar.
*Narrow money = currency in circulation plus demand deposits and close substitutes. Broad money = narrow money plus time deposits, notice accounts, repos and bank securities. Precise definitions vary by country. Narrow money has been more reliable than broad money for forecasting purposes historically and is consequently emphasised in the analysis here. Real = inflation-adjusted.
**The adjusted measure holds Indian narrow money M1 stable at its pre-demonetisation level.


