Entries from July 1, 2016 - July 31, 2016
Global economy firming at mid-year
Available June industrial output data suggest that the global economy was picking up at mid-year, consistent with an earlier revival in real narrow money growth, which strengthened further last month. A positive view of economic prospects will be maintained here unless narrow money trends weaken, with such a weakening deemed unlikely.
The US, China and Russia have released June industrial output data, together accounting for 50% of the G7 plus emerging E7 aggregate tracked here. Results were above expectations in all three cases. Assuming no change in output from May in the other countries, six-month growth of G7 plus E7 output will have risen to 0.8%, or 1.6% at an annualised rate, the fastest since February 2015 – see first chart.
A mid-year pick-up had been suggested by global narrow money trends: six-month growth of G7 plus E7 real narrow money bottomed in August 2015 and rate of change turning points have led those in industrial output by an average of nine months historically. Real narrow money growth strengthened further last month, based on data covering the US, China, Japan, India and Brazil, together accounting for 67% of the G7 plus E7 aggregate. The current economic upswing, therefore, may extend through March 2017, at least.
Will Brexit affect monetary trends and the economic outlook? Narrow money is demand-determined, with demand influenced importantly by the spending intentions of firms and households, explaining why it leads the economy. The Brexit shock may dent confidence temporarily but spending plans should be supported by a post-vote fall in interest rate expectations. Narrow money trends, therefore, may remain solid, except (probably) in the UK. US narrow money in the latest week, ending 4 July, was 0.8% above its June average level.
As previously discussed, the economic significance of narrow money strength is often disputed on the grounds that zero / negative interest rates are putting downward pressure on the velocity of circulation. As long as the rate of change of velocity is less volatile than that of real narrow money, however, turning points in the latter should still signal future turning points in economic momentum. The value of a forecasting approach that identifies the future direction of economic growth should not be underestimated.
The relationship between levels of real narrow money and economic growth, moreover, can be partially restored by adjusting for a long-run downward trend in the rate of change of velocity. The red line in the second chart incorporates such an adjustment, while also allowing for the average nine-month lag between money and output changes. The fit of the relationship shows no sign of deterioration in recent years – industrial output growth was close to the “forecast” in June, with a significant pick-up indicated.
The green line improves the fit slightly further by incorporating the slope of the G7 government yield curve, which is widely monitored as a long leading indicator. The suspicion here is that the information content of the yield curve has been reduced in recent years by unprecedented market intervention by central banks. A flattening of the curve over the past year tempers but does not offset the positive signal for economic prospects from narrow money trends.
Why is UK note demand surging?
The stock of UK notes and coin in circulation was growing strongly before the Brexit referendum and the rate of increase has risen further since the vote. This may indicate resilience in retail spending. Alternatively, the public may be “hoarding” cash in expectation of negative interest rates and / or restrictions on the supply of £50 notes.
Annual growth in notes and coin reached a seven-year high of 7.4% in April / May, remaining strong at 7.0% in June (month averages). Weekly statistics on the note issue indicate a further pick-up since the Brexit vote. As of last Wednesday (13 July), the stock of notes was 8.9% higher than in the corresponding week in 2015 – see first chart.
The annual change in real notes and coin (i.e. deflated by consumer prices) has displayed a significant contemporaneous correlation with the annual change in retail sales volume since the late 1980s (at least) – second chart*. The relationship, however, broke down temporarily around the turn of the century and during the 2008-09 financial crisis as worries about the banking system caused the public to hoard cash**. The Brexit vote is unlikely to have prompted similar concerns. Strong notes growth, therefore, may indicate that retail spending has remained solid since the referendum.
Alternatively, people may be hoarding notes not for safety reasons but because the Bank of England is expected to cut interest rates significantly, possibly even imposing a negative rate on bank reserves, forcing banks to start charging for operating current accounts. The Monetary Policy Committee has signalled that policy will be eased in August and the Bank’s chief economist, Andrew Haldane, has advocated a “sledgehammer” approach. Mr Haldane mused approvingly about negative rates in a speech last year and may wish to use the Brexit vote as an excuse to launch such an experiment.
Hoarding may also reflect increased demand for £50 notes due to uncertainty about their future supply. According to the Bank’s 2016 Annual Report, the value of £50 notes in circulation rose by 11.6% in the year to end-February, while lower-denomination notes increased by only 5.1%. Governor Carney confirmed in June that there are no plans to introduce a plastic version of the £50 note, fuelling fears raised by Mr Haldane’s earlier speech that the Bank intends to restrict the future supply of cash in order to create scope for interest rates to fall further below zero.
*Correlation coefficient = 0.61 since 1989.
**The concerns in late 1999 reflected the possible impact of the Y2K changeover on banks’ computer systems.
Chinese nominal GDP rebounds, money signal still positive
Stronger Chinese monetary trends late last year suggested that economic growth would recover during the first half of 2016, contrary to consensus expectations of a further slowdown. Key indicators firmed through the spring but by less than had been expected here. Second-quarter GDP and June activity numbers released today were, on balance, more encouraging, while the monetary signal remains positive.
Annual growth of GDP in volume terms was unchanged at 6.7% last quarter but the more significant news was that nominal GDP expansion rose for a second successive quarter to 7.3%*, the strongest since the fourth quarter of 2014. A rebound had been signalled by a pick-up in money growth from mid-2015. Annual increases in narrow and broad money (as measured by “true” M1 and M2 excluding financial sector deposits) were little changed in June, with recent growth the fastest since 2010 and 2013 respectively – see first chart**.

June activity numbers were mixed. Annual growth of industrial output and retail sales value rose to 6.2% and 10.6% respectively in June, beating consensus expectations. Fixed asset investment, however, slowed further, with an annual value rise of 7.3%, close to a September 2015 low of 6.8% – second chart.

Capex weakness reflects the private sector component, which stagnated in the year to June – third chart. Prospects for private investment, however, are judged here to have improved. Industrial profits lead private capex and are rebounding on the back of stronger nominal GDP growth. A pick-up in growth of deposits of non-financial enterprises over the past year is a further positive signal – fourth chart.

An investment revival coupled with continued solid consumer spending expansion and an export pick-up driven partly by recent exchange rate depreciation may result in stronger volume as well as value growth of GDP during the second half, despite some reduction in fiscal stimulus.
*Corrected from 8.2% originally reported by Thomson Reuters Datastream.
**”True” M1 includes household demand deposits, which are excluded from the official M1 measure. Financial sector deposits are excluded from M2 because they are volatile and less relevant for assessing spending prospects.
G7 leading indicator rising before Brexit vote
The OECD’s G7 composite leading indicator (CLI) strengthened in May, providing further confirmation that the global economy was picking up before the Brexit vote shock. The global impact of the shock is expected here to be minor and offset by a post-vote loosening of financial conditions – the forecast of a rise in growth during the second half, therefore, will be maintained, unless narrow money trends weaken.
The OECD was due to release May leading indicator data on Monday but instead announced that publication would be suspended until September, on the grounds that the Brexit vote was a “significant unexpected event, which is affecting the underlying expectation and outturn indicators used to construct the CLIs”. This is a strange decision: the OECD has never before suspended publication of its entire suite of indicators in response to a shock and it seems a stretch to argue that the Brexit result is more significant than some previous unexpected events (e.g. the 911 terrorist attacks)*.
It is, however, straightforward (if laborious) to replicate the OECD’s calculations to estimate the May data. The first chart shows published and estimated values of the “normalised” version of the G7 leading indicator – rises / falls signal that future GDP growth will be above- / below-trend. This fell steadily during 2015 and early 2016 but stabilised in April and is estimated to have risen slightly in May. The indicator, that is, suggests that growth was on course to move from below- to above-trend during the second half, before the Brexit vote shock.
The second chart shows an alternative version of the indicator designed to predict the level of industrial output rather than the ratio of GDP to trend. The six- and one-month changes in this indicator continued to firm in May, clearly signalling a coming rise in industrial output momentum.
The US component of the G7 indicator has been the main driver of its recent pick-up. The six-month and one-month changes in the US indicator strengthened further in May, confirming an earlier positive signal from faster real narrow money growth – third chart.
The Brexit vote result has the potential to depress the G7 leading indicator via impacts on business / consumer surveys, yield curve slopes and stock prices**. The MSCI All-Country World Index in US dollars, however, has already rebounded to above its level before the 23 June vote, while yield curve flattening has started to reverse. Any survey weakness should be mitigated by expectations of easier monetary policy and may prove temporary.
*The Japanese indicator only was suspended for two months following the March 2011 earthquake / tsunami.
**All G7 country indicators contain at least one business survey component. All except Japan and Germany include consumer sentiment / confidence. The slope of the yield curve is a component of the US, Japanese and German indicators. Stock prices appear in the US, Japanese, UK, French and Canadian indicators.
Global growth: stay positive unless money trends reverse
Global economic growth appeared to be picking up at mid-year, as had been suggested by a rise in real narrow money expansion in late 2015. The view here is that the Brexit vote shock may delay but is unlikely to derail a further improvement in economic momentum during the second half. This view will be reassessed if narrow money trends weaken, which is not expected.
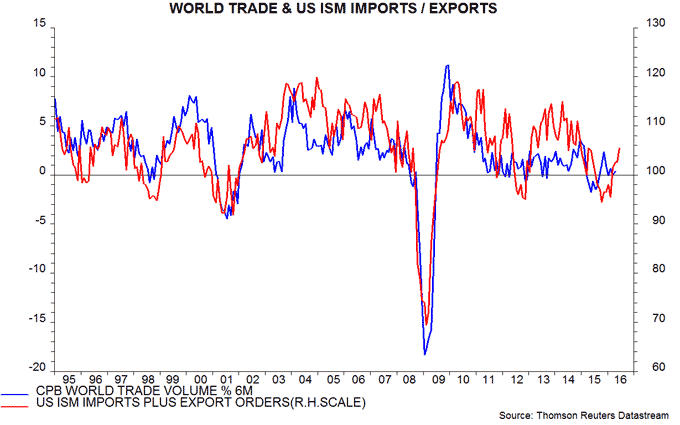
The suggestion of a mid-year pick-up is supported by industrial output data and business surveys. The six-month change in global (i.e. G7 plus emerging E7) industrial output appears to have risen to a seven-month high in May, based on available data. Manufacturing purchasing managers’ surveys for June reported increases in new orders indices in the US, Japan, Eurozone and UK. The sum of the import and export orders indices in the US ISM survey rose to a 14-month high, consistent with a recovery in global trade volumes – see first chart.
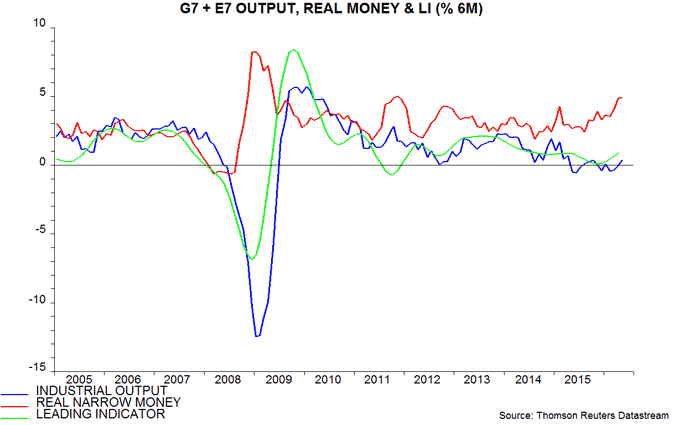
A pick-up had been signalled by a rise in global six-month real narrow money expansion in late 2015, with this signal confirmed in early 2016 by an upturn in a non-monetary leading indicator based on OECD country leading indicator data. Real money growth continued to rise during the first half, reaching its highest level since 2011 in May, suggesting strong second-half economic prospects – second chart.
As previously discussed, the global implications of expected post-Brexit-vote UK economic weakness are minor, even for the rest of Europe – the UK accounts for 2% of the IMF’s world GDP measure, while exports to the UK represent 3% of the GDP of the rest of the European Union. The concern is that the shock may trigger other negative developments resulting in a sustained “risk-off” move in markets that feeds back into weaker demand globally.
The market response to date has been reassuring, with “safe” government bond yields down sharply but equity market indices and credit spreads broadly stable – expectations of easier monetary policy, in other words, have prevented an investor shift towards economic pessimism.
The fall in yields, unless reversed, is likely to be reflected in further reductions in bank deposit and lending rates, suggesting that monetary trends are more likely to strengthen than weaken as a result of the shock.
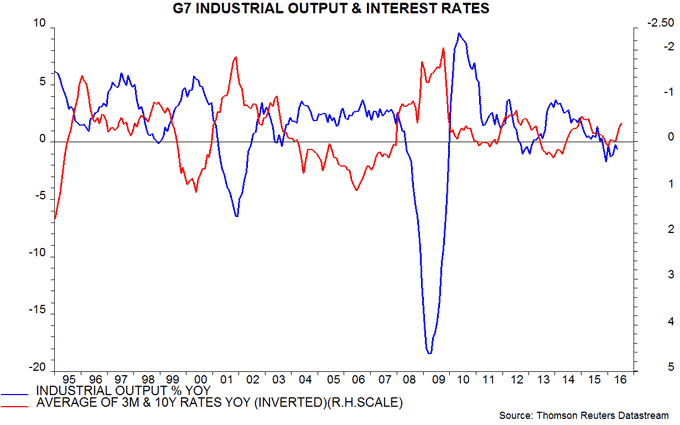
The annual change in an average of G7 short-term rates and 10-year government yields is an inverse long leading indicator of economic growth. The current average is 40 basis points lower than a year ago, representing a significant turnaround from a small annual rise in December / January – third chart.
A possible analogy is the aftermath of the 1987 stock market crash, which damaged business confidence and led many economists to predict a recession. It occurred, however, against a backdrop of an improving economy and a post-crash drop in interest rates provided further stimulus, resulting in stronger-than-expected growth in 1988.
Global business surveys for July are quite likely to show a knee-jerk negative response to the Brexit vote shock. The focus here, instead, will be on whether recent strong narrow money trends start to reverse. An initial assessment will be possible in late August following release of July monetary data for the major economies.
UK economy at cruising speed entering Brexit storm
Data this week confirm that the UK economy was growing solidly before the EU referendum, in line with the positive assessment in previous posts here but contrary to consensus gloom.
Revised figures show that GDP grew by 0.45% in the first quarter, up from a previous estimate of 0.36%. The consensus had expected a sharp slowdown, or even stagnation, in the second quarter. Output of the key services sector, however, increased significantly in April (as had been suggested by turnover data), to stand 0.5% above its first-quarter average.
With previously-released data showing large gains in industrial and construction output, April GDP is estimated to have grown by 0.6% from its first-quarter level.
The April numbers were probably flattered by the early timing of Easter, suggesting a relapse in May / June. On current evidence, however, the first estimate of second-quarter GDP growth to be released on 27 July is unlikely to be less than 0.4%.
The Markit manufacturing purchasing managers’ survey for June, meanwhile, was upbeat, with the forward-looking new orders component at its strongest level since October.

