
Entries from January 1, 2022 - January 31, 2022
Don't exaggerate UK labour market "strength"
 Simon Ward
 1 Comment
The UK labour market has recovered impressively but isn’t at risk of “overheating”, as claimed by economists quoted in write-ups of this week’s data.
The number of payrolled employees is at a record but this partly reflects a large number of self-employed people switching to employee status during the pandemic. The comprehensive Labour Force Survey measure of employment remains 600,000 below its peak – see chart 1.
Chart 1

The unemployment rate for the 16-64 age group of 4.2% is almost back to its pre-pandemic low of 3.8% but has been suppressed by a rise in inactivity, which is 1.2 pp higher as a share of the labour force, i.e. the jobless rate would be 5.4% if inactivity had remained stable – chart 2.
Chart 2

High inflation is putting upward pressure on wage settlements but the six-month growth rate of regular earnings (i.e. excluding bonuses) is currently no higher than in mid-2019, at 3.7% annualised – chart 3.
Chart 3

Weak / negative real money growth is likely to be reflected in a loss of economic momentum, implying labour market cooling – chart 4. Vacancies lead and may be peaking – chart 5.
Chart 4

Chart 5

Has the Fed called the top in growth (again)?
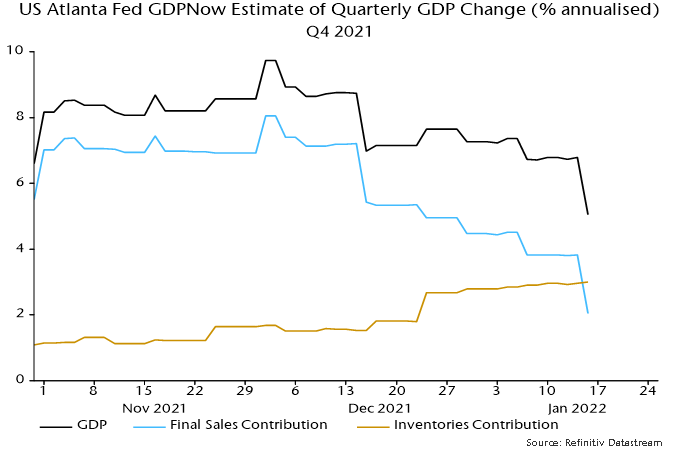
Recent US economic news has surprised negatively when properly weighted for significance. The Atlanta Fed’s nowcast of the contribution of final sales to Q4 annualised GDP growth has been slashed from 8.1 percentage points at the start of December to just 2.0 pp currently – see chart 1.
Chart 1
The most recent lurch down was driven by shockingly bad December retail sales – inflation-adjusted sales have now dropped 10% from their stimulus-inflated March peak.
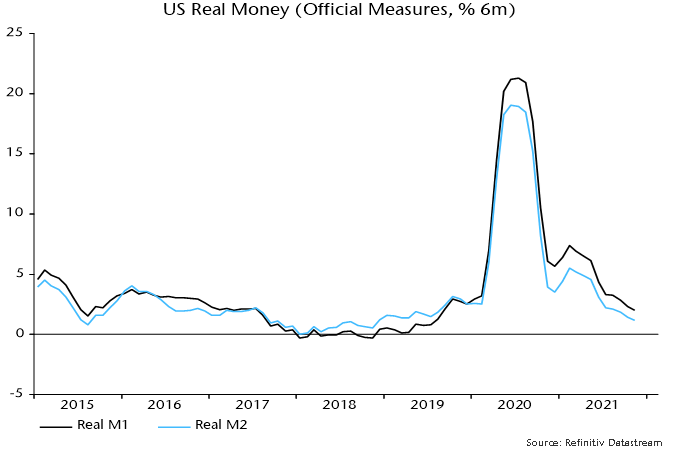
The consensus is discounting weakness as temporary and due to the omicron wave. The “monetarist” forecast is that a cyclical slowdown is under way related to a big fall in real money growth since 2020 – chart 2.
Chart 2
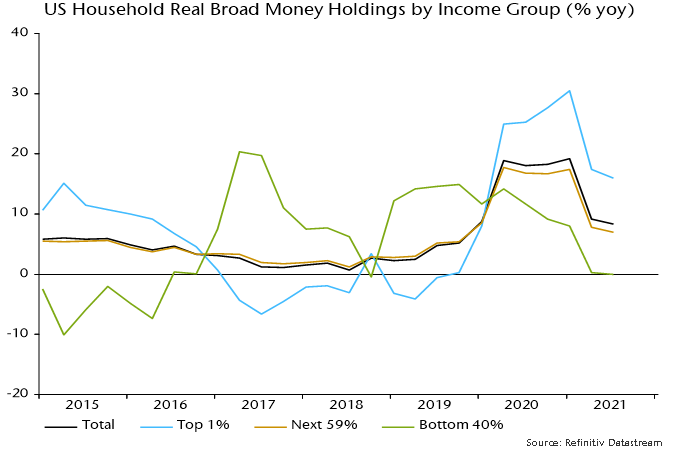
The distribution of money growth, moreover, looks unfavourable for demand growth. Broad money balances have risen fastest for high-income households with a lower propensity to consume. Money holdings of the bottom 40% of earners were stagnant in real terms in the year to end-Q3 – chart 3.
Chart 3
The Atlanta Fed’s Q4 GDP growth nowcast is still up at 5.0% but this reflects a whopping 3.0 pp contribution from inventories – consistent with the view here that the stockbuilding cycle is peaking.
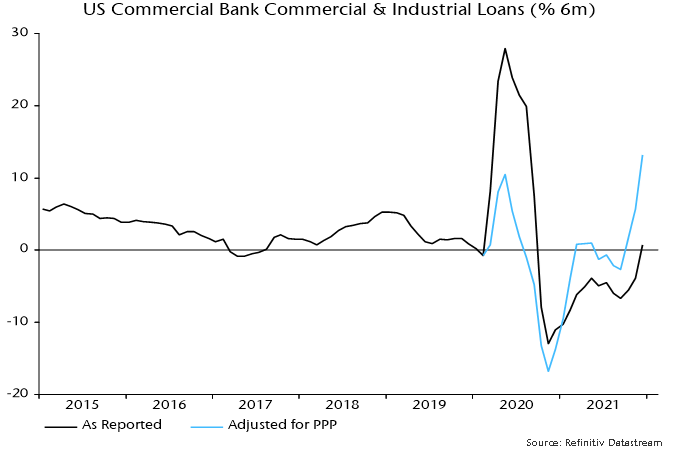
The latter estimate is based on inventory data through November but the December retail sales slump suggests further stockpiling. So does another bumper monthly rise in commercial and industrial loans, which are strongly influenced by inventory financing needs – chart 4.
Chart 4
The Fed’s “hawkish pivot” was predicated on a strong economy* but the Fed is often facing the wrong way at turning points. Officials are likely to row back if activity data continue to disappoint, even if inflation news remains unfavourable.
*From Chair Powell’s testimony to the Senate Banking Committee on 11 January: ”Today the economy is expanding at its fastest pace in many years, and the labor market is strong.”
Equity rotation consistent with liquidity squeeze
The violent rotation in equity markets since the start of the year appears to have been driven by a tightening of liquidity conditions hitting high-flying growth stocks, rather than signalling increased economic optimism and a resumption of the late 2020 / early 2021 “reflation trade”.
The price relative of MSCI World value to growth surged 8.1% between 31 December and last week’s close, reaching its highest level since June. The relative of non-tech cyclical sectors to defensive sectors was up by “only” 1.4% over this period and remains below a November secondary peak – see chart 1.
Chart 1

The behaviour of the cyclical to defensive sectors relative is consistent with the view here that the global manufacturing PMI new orders index is in a downtrend – chart 2. This relative has displayed a much stronger correlation with the PMI historically than value vs. growth.
Chart 2

Global six-month real narrow money growth leads the PMI and is estimated to have been little changed in December from November’s 27-month low. The suggestion is that the PMI will move lower in H1 with no recovery before Q3 at the earliest – chart 3.
Chart 3

The view that equity market moves reflect liquidity tightening rather than reflation optimism is supported by the stability of Treasury market breakevens and a rising real yield – chart 4.
Chart 4

As previously discussed, both measures of global “excess” money tracked here are now negative for the first time since 2019.
On this view, the Fed’s “hawkish pivot” has been coincident with rather than the key driver of tighter liquidity.
Growth stocks may continue to suffer near term but the forecast of a global economic slowdown suggests approaching liquidity relief. The rally in the cyclical vs. defensive sectors relative, meanwhile, may reverse as activity news disappoints.
A "monetarist" perspective on current equity markets
Monetary indicators have weakened further over the last three months and are signalling a slowdown in global economic momentum during H1 2022 along with a loss of “excess” money support for markets.
Global six-month real narrow money growth peaked in July 2020 and fell significantly during 2021 – see chart 1. Real money trends typically lead economic momentum by six to 12 months. The global manufacturing PMI new orders index – a timely indicator of goods demand momentum – peaked in May 2021, falling over the summer but stabilising in Q4. With real money growth continuing to weaken into November, the PMI decline is expected to resume, with a low unlikely to be reached until mid-2022 at the earliest.
Chart 1

Industrial output numbers rebounded in late 2021 as supply constraints eased, allowing earlier orders to be fulfilled and inventories replenished. The monetary signal of weakening demand momentum argues that this pick-up will prove short-lived.
Monetary support for markets depends not on the absolute level of real money growth but rather its deviation from the rate required to support economic expansion, i.e. “excess” money growth. Two proxy measures are monitored here: the gap between six-month growth rates of real narrow money and industrial output; and the deviation of annual real money growth from a long-term moving average. Over 1970-2021, global equities outperformed US dollar cash by 17.7% per annum when the two measures were positive (allowing for data reporting lags) but underperformed by 9.2% when both were negative.
A double positive “buy” signal was issued at the end of April 2020 but a double negative “sell” now appears imminent. The second of the two measures turned negative in October 2021 and the first appears to have done so in November – confirmation awaits additional industrial output data to be released in early January.
Economic prospects for H2 2022 have yet to crystallise and will partly reflect monetary developments early in the year. Cycle analysis, however, suggests a further loss of momentum. Specifically, the global stockbuilding cycle, which averages 3.33 years, is scheduled to reach another low in 2023, implying that a downswing will begin during 2022. Such downswings are usually associated with significant economic weakness and underperformance of cyclical assets.
Could weakness tip over into a full-scale recession in 2022-23? This is not the central case here, for two reasons. First, global six-month real narrow money momentum usually turns negative before recessions but, though weak, remains positive currently, with stabilisation / recovery possible in early 2022. Secondly, the longer-term business investment and housing cycles are scheduled to remain in upswings in 2022-23 – recessions are usually associated with joint cycle downswings.
US economic and equity market outperformance in 2020-21, on the view here, reflected much stronger money growth in the US than elsewhere – chart 2. Six-month real narrow money growth is now slightly lower than in the rest of the G7, suggesting dimmer relative prospects, although US equities are usually defensive in a slowing economic environment.
Chart 2

China was a monetary laggard in 2020-21 but six-month real narrow money growth has stabilised and is now in the middle of the range across major economies. Broad money growth up has picked up and the recent Q4 PBoC bankers’ survey suggests that loan officers have been instructed to increase credit supply. Stronger narrow money numbers would confirm an improving outlook, although a significant recovery in economic growth is unlikely until later in 2022 and could be held back by global weakness.
Money trends appear relatively favourable elsewhere in the Asia-Pacific region, with real money growth picking up recently in Australia and the ASEAN economies and remaining solid in Korea / Taiwan.
The suggested scenario of a global economic slowdown would be expected – based on the experience of recent decades – to be associated with a dovish revision to monetary policy expectations and downward pressure on Treasury yields. Will unfavourable inflation news force the Fed and other central banks to maintain or accelerate tightening plans in 2022 despite fading economic momentum? The expectation here is that inflation will slow significantly in 2022, although monetary trends are not yet consistent with a return to the pre-pandemic norm.
Chart 3 shows that the surge in US six-month core CPI momentum in 2021 mirrored a surge in broad money growth 14 months earlier. This is a shorter lag than typically found in historical studies but the inflationary process may have been accelerated by supply-side disruption due to the pandemic. The apparent relationship suggests a slowdown in core CPI momentum in H1 2022 but current broad money growth remains above the pre-pandemic average, arguing against a full reversal of the 2020-21 rise.
Chart 3

Headline inflation rates, however, are likely to fall more sharply and may move below core rates later in 2022 as commodity prices soften with economic momentum.
The judgement here is that inflation progress will be sufficient to sustain the normal relationship between Treasury yields and economic momentum, i.e. yields are likely to remain capped in the near term and fall later in 2022. The recent supposed “hawkish pivot” by the Fed is not expected to be sustained, with a shift back to the “transitory” narrative likely as economic / inflation data cool and mid-term elections approach.
The suggestion of a decline in Treasury yields in 2022-23 is consistent with the stockbuilding cycle – yields usually reach a low within several months of the cycle trough, which is scheduled for around mid-2023 if the current cycle conforms to the average length.
The stockbuilding cycle is a significant influence on market behaviour more generally. In equity markets, defensive sectors, quality and high yield usually outperform in the 18 months leading up to a cycle trough – see table.

The weakness of EM equities in 2021 was a departure from the usual pattern of outperformance during cycle upswings and – on the view here – reflected monetary tightness in China, which now dominates the asset class. This raises the possibility that Chinese monetary loosening will support above-average performance during the downswing – confirmation that narrow money growth is following a recovery elsewhere in EM Asia could warrant at least a neutral weighting.
