
Entries from January 1, 2020 - January 31, 2020
Chinese nominal GDP confusion: slowdown confirmed
 Simon Ward
 Post a Comment
The Chinese GDP numbers released on Friday appeared to show a strong pick-up in nominal growth in Q4. This was puzzling but possibly attributable to the recent food-driven inflation surge. Some analysts latched onto the pick-up as a bullish signal.
The numbers carried by Datastream changed over the weekend and now show a slowdown rather than acceleration in Q4. The explanation is that there have been upward revisions to the level of nominal GDP in previous quarters, which weren’t available on Friday – we were comparing the new Q4 number with old-basis data for earlier quarters.
The expectation here has been that two-quarter nominal GDP expansion would fall in H1 2020 in lagged reflection of declines in six-month growth rates of money and credit since Q2 2019. The new numbers suggest that that this slowdown has already started – see chart (revised from Friday’s post).

Is China recovering?
Chinese official activity data for December mostly surprised positively, echoing an earlier PMI revival. With the PBoC cutting reserve requirements further at the start of the year, local governments stepping up issuance of infrastructure bonds and a “phase 1” US-China trade deal now concluded, is the economy on track to recover in H1 2020?
Monetary trends suggest not. Six-month growth rates of the narrow and broad money measures followed here were little changed in December, having fallen since Q2 2019. Credit expansion also remained cool – see first chart. (Note: the GDP numbers used in this chart were subsequently changed - see here.)

The “monetarist” interpretation is that the improvement in economic data at year-end reflected a recovery in money growth in early 2019, which went into reverse after the first of several regional bank failures in May and an associated tightening of credit conditions. The post-Q2 monetary slowdown suggests a relapse in economic data from Q1 2020.
The US-China trade deal locks in the bulk of recent tariffs, probably until 2021 (or later), and may result in President Trump redirecting his protectionist energies towards Europe.
Will the latest PBoC reserve requirement ratio cut, along with better economic data and additional fiscal spending, result in an easing of credit conditions in early 2020? The CKGSB corporate financing index for January, released towards month-end, will be an important data point: it continued to soften in December – second chart. Any recovery in credit conditions and money growth in early 2020, though, would be unlikely to be reflected in economic data until late in the year.

UK inflation slump piles pressure on tardy MPC
The forecast here a year ago was that the MPC would cut Bank rate to 0.5% during 2019. This was wrong in fact but right in spirit, as reflected in a significant downward shift in the yield curve.
The expected cut was probably pushed back by Brexit and election uncertainty but recent MPC communications and this week’s weak GDP and inflation data suggest that it will be delivered on the 30 January decision date.
The consensus thinks that a big enough bounce in January flash PMIs released next Friday could yet persuade the MPC to hold fire. This is doubtful and Tuesday’s labour market report may be more important – confirmation that employment has stalled and earnings growth is cooling would probably cement a January cut.
The volatile air fares component contributed to a decline in core CPI inflation to 1.4% (1.37%) in December, a three-year low, but there were also downward moves in food, non-energy industrial goods and recreational and personal services. A November post suggested that the core rate would fall further based partly on a lagged relationship with core producer output price inflation, which continued to plunge last month – see first chart.
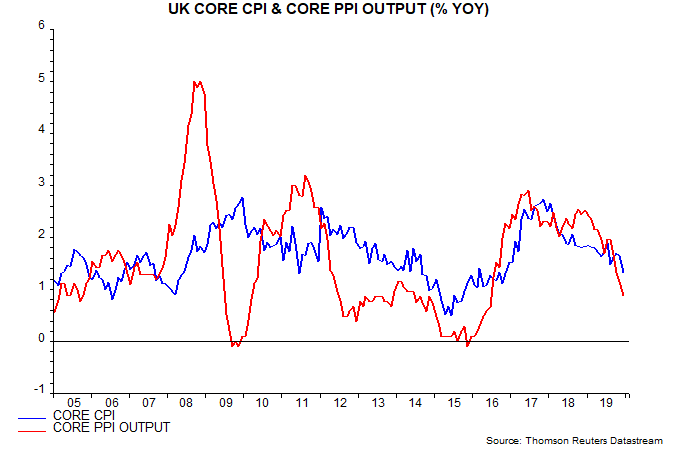
From a causal perspective, inflationary pressures are ebbing in lagged response to a fall in annual broad money growth – as measured by non-financial M4 – from nearly 7% in late 2016 to below 3% in late 2018: the monetarist rule of thumb is that money trends lead prices by about two years on average, although the relationship can be temporarily disrupted by large exchange rate swings (such as the post-EU-referendum depreciation) – second chart. The suggestion is that core inflation will continue to ease through 2020 barring a sizeable fall in sterling.

A "monetarist" perspective on current equity markets
The baseline scenario in our previous quarterly commentary was that global economic momentum, having bottomed in Q3 2019, would remain weak in early 2020 before strengthening towards mid-year. Recent monetary and cycle evidence has reinforced our caution about near-term prospects while suggesting that a significant reacceleration will be delayed until H2. With recovery hopes now high, and central bank actions unlikely to be as market-supportive as during H2 2019, equities and other cyclical assets may be at risk of a set-back.
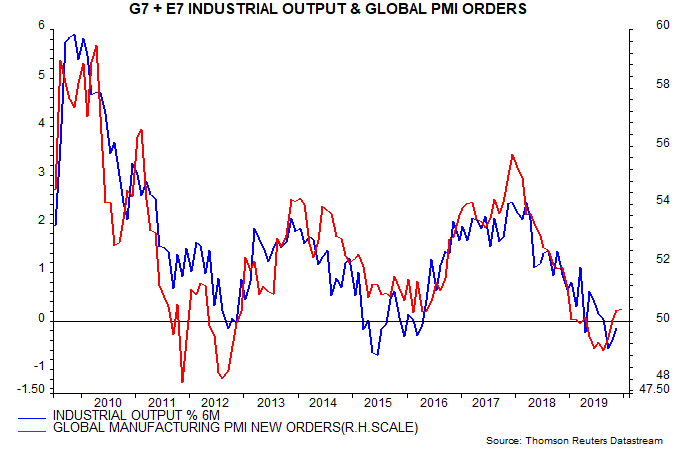
Coincident data support the view that economic momentum bottomed in Q3. The Markit global manufacturing PMI new orders index recovered from a seven-year low of 49.0 in August to 50.4 in November, moving sideways in December. The six-month change in G7 plus emerging E7 industrial output bottomed at -0.6% in September, though appears to have remained negative through November – see first chart.
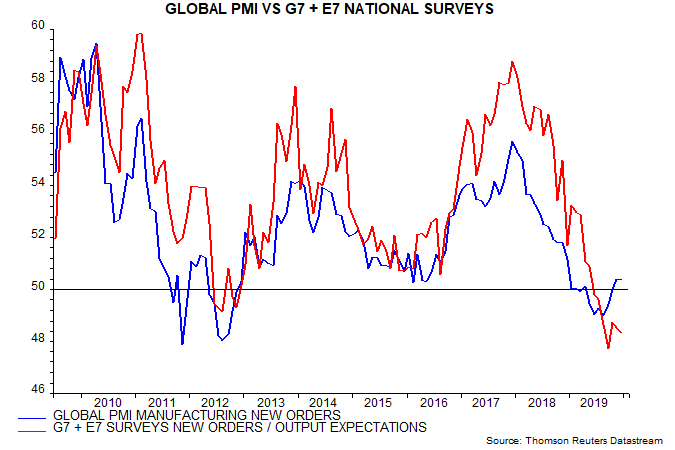
The PMI new orders index remains weak by historical standards, suggesting barely positive industrial momentum. National business surveys, moreover, are giving a more downbeat message: a composite of forward-looking components of G7 plus E7 national surveys, calculated on a PMI basis, has yet to regain the 50 level – second chart. The US ISM and Chinese NBS surveys, in particular, are lagging well behind their Markit counterparts.
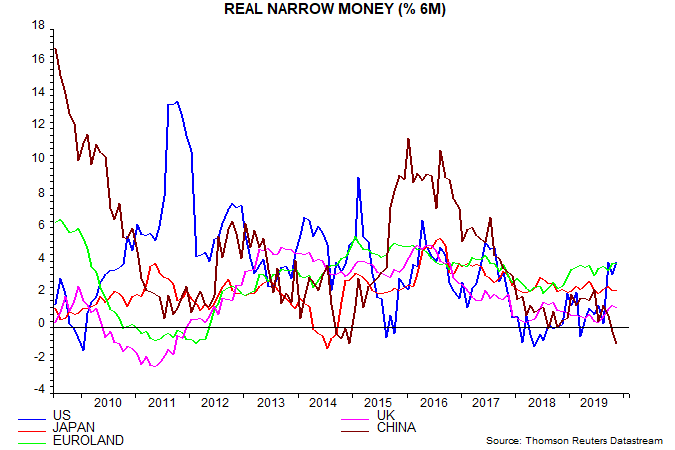
The forecast of a Q3 low in economic momentum was based partly on monetary trends: six-month growth of G7 plus E7 real narrow money bottomed in November 2018 and leads activity by about nine months on average – third chart. Real money growth showed limited recovery through August 2019, leading us to expect economic news to remain weak in early 2020. Our previous commentary, however, expressed hope that money trends would pick up convincingly in late 2019, warranting optimism about economic prospects for mid-2020 and beyond.
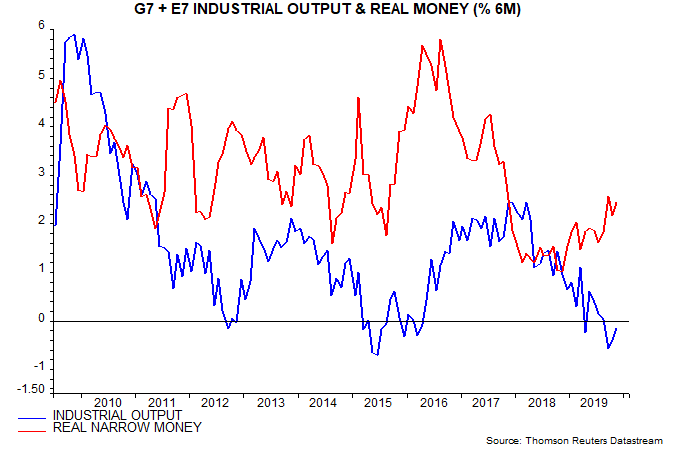
Real narrow money growth did rise further but, at 2.4% (not annualised) in November, remains below the 3% level we judge necessary to signal an economic recovery, in the sense of a return to trend or above-trend expansion. The 3% pre-condition appears undemanding: real money growth has averaged 3.2% since the GFC (i.e. over 2010-18) and reached over 4% before the recoveries in 2012-13 and 2016-17.
The suggestion, therefore, is that global economic growth will remain below-trend at least through mid-2020, in turn implying softer labour markets, continued profits weakness and vulnerability to negative shocks, such as an oil price spike or renewed trade conflict.
Our global real narrow money measure has been dragged down by a deepening contraction in China – fourth chart. A recovery in Chinese nominal money growth in early 2019 went into reverse following the failure of several regional banks and an associated tightening of credit conditions, while consumer price inflation was pushed up by a surge in pork prices following devastation to hog stocks from African swine fever.
A further cut in reserve requirement ratios at the start of 2020 is unlikely to alleviate the credit shortage, which reflects smaller banks’ funding difficulties and economic risk aversion rather than insufficient banking system liquidity. The corporate financing component of the Cheung Kong Graduate School of Business survey, measuring ease of access to external finance, fell further into end-2019. Real money trends will be boosted by a normalisation of CPI inflation but the timing is uncertain.
US real narrow money growth was weak through August 2019 but rose sharply in September, maintaining the higher level through Q4. This is a positive signal for US economic prospects but not before mid-2020 – near-term risks are judged to lie on the downside, reflecting incomplete inventory adjustment, slowing consumption and Boeing’s suspension of 737 MAX production, which is expected to cut manufacturing output by about 1%.
Euroland money trends remain solid but dependence on exports and business investment suggest that a growth pick-up will be delayed until global economic conditions improve. UK real money growth has recovered slightly but is still low – we await December / January data for a post-election signal but do not expect a further pick-up given the MPC’s refusal to cut rates. The BoJ has also bucked the global trend towards easing: both central banks are relying, probably unwisely, on fiscal stimulus providing an economic lift.
The signal from monetary trends of weak near-term global economic prospects is supported by cycle analysis. Our previous commentaries suggested that the global stockbuilding and business investment cycles would bottom out in Q3 2019 and Q1 2020 respectively. We maintain these datings but now expect a recovery in the stockbuilding cycle to be delayed until Q2 2020, implying that the net impact of the two cycles will remain negative in early 2020.
The fifth chart shows the contribution of stockbuilding to annual GDP growth for the G7 and US alone. The G7 contribution was significantly negative in Q3 2019, consistent with the cycle being at or near a low. The cycle has averaged 3.5 years in recent decades and a Q3 low would be an exact 3.5 years from the previous low in Q1 2016.
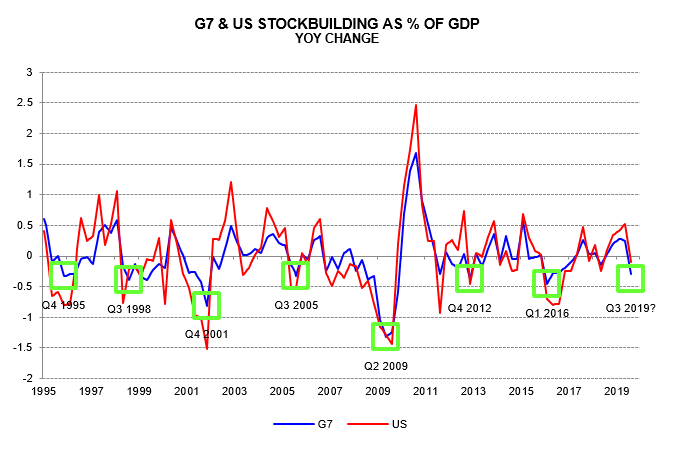
The G7 stockbuilding drag in Q3, however, reflected extreme weakness in Germany and the UK, while the US contribution was only slightly negative. The US drag is expected to intensify in Q4 and Q1, delaying a recovery at the G7 level.
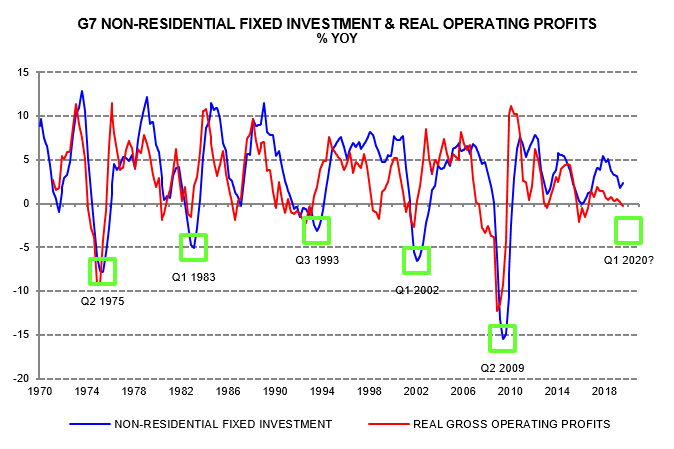
The G7 business investment cycle last bottomed in Q2 2009 and has a maximum length of 11 years, implying a low by Q2 2020 at the latest. Based on experience in recent decades, a cycle low is likely to involve the annual change in investment turning negative and undershooting the annual change in real operating profits – sixth chart. The annual investment change was still positive and ahead of the profits change in Q3, supporting the expectation of further weakness into H1 2020.
What does the economic scenario described above imply for market prospects? As explained in previous commentaries, market behaviour has often shifted from defensive / risk-off to pro-cyclical / risk-on around stockbuilding cycle lows. Solid equity market performance in Q4, along with outperformance of cyclical sectors / EM and underperformance of safe bonds, are consistent with the assessment that the cycle bottomed in Q3.
With a stockbuilding recovery now judged likely to be delayed until Q2 2020 or later, however, these pro-cyclical market trends could stall or reverse near term.
Markets were also boosted in Q4 by renewed Fed and ECB balance sheet expansion. The Fed, however, made clear that its actions were intended to relieve a shortage of bank reserves and did not represent a resumption of QE. With money markets remaining calm into end-2019, the Fed may curtail repo operations after January and cease Treasury bill purchases early in Q2, suggesting that its balance sheet is peaking.
Absent further central bank stimulus, markets may struggle to sustain recent gains. In our framework, a favourable “excess” money environment is indicated by global real narrow money growing faster than both industrial output and its long-run average. The latter condition remains unfulfilled and equity returns have been below average when this has been the case historically.
We remain inclined to expect economic growth to strengthen in H2 2020 as the stockbuilding and business investment cycles enter recoveries and lower interest rates reenergise the longer-term housing cycle upswing; such a scenario would be confirmed by a rise in global real money growth above the 3% threshold. A strong pick-up would present different challenges for markets: with spare capacity limited, above-trend economic expansion would be likely to feed through swiftly to inflation, forcing central banks to choose between early policy tightening and accommodating a medium-term overshoot of targets.
US inventory cycle yet to bottom
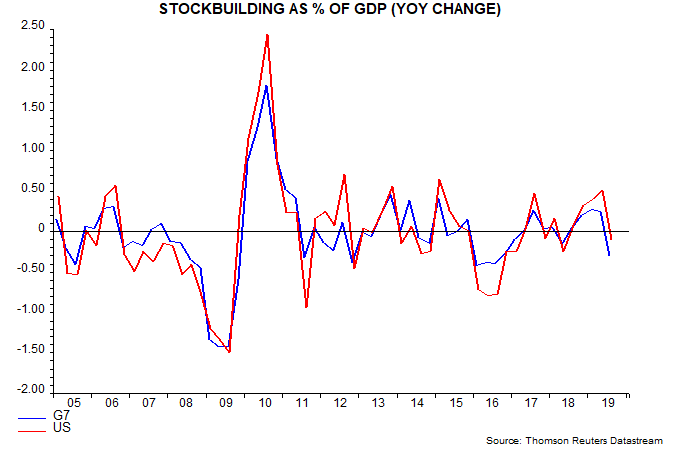
The modest revival in the global manufacturing PMI in late 2019, on the view here, partly reflects a bottoming out of the global stockbuilding (inventory) cycle. US inventory adjustment, however, appears incomplete and may prevent a recovery in the global cycle until later in 2020.
The first chart shows the contribution of stockbuilding to annual GDP growth in the G7 and the US alone. The G7 drag in Q3 was the largest since 2016, when the global cycle last bottomed. This reflects extreme weakness in Europe – particularly Germany and the UK. The US contribution, by contrast, was only slightly negative in Q3.
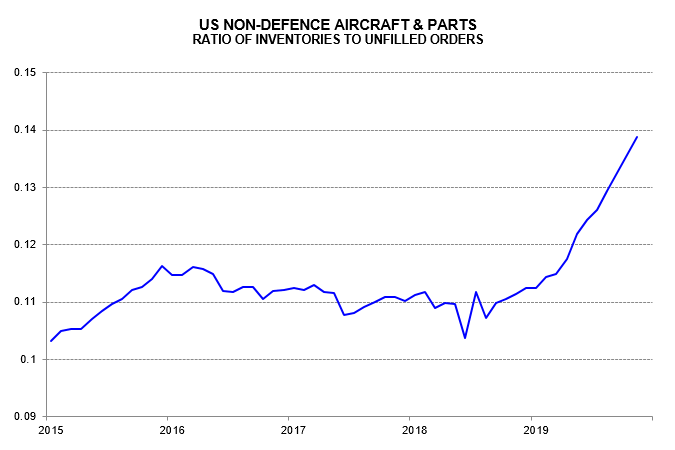
Why has US adjustment lagged? Some firms may have maintained higher inventories of Chinese goods in anticipation of further tariff increases. Another contributing factor has been Boeing continuing production of the 737 MAX last year despite sales being halted. Non-defence aircraft and parts accounted for nearly 30% of the economy-wide rise in inventories in Q3 – second and third charts.
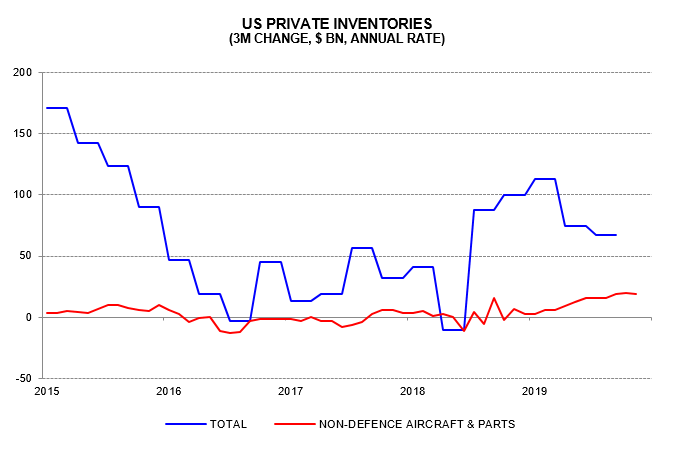
The suspension of 737 MAX production from this month will halt the rise in inventories in the sector and reverse it when shipments eventually resume – possibly in Q2. A reasonable working assumption is that the change in non-defence aircraft and parts inventories will swing from +$18 billion at an annualised rate in Q4 2019 to -$18 billion in Q2 2020. This would equate to a shift of 0.175% of GDP over two quarters, or 0.35% at an annualised rate. The overall GDP impact would be smaller because a resumption of shipments would be reflected in other GDP components (i.e. exports and business investment).
Strong US money growth in late 2019 warrants optimism about economic prospects for later in 2020 but earlier monetary weakness and the inventory overhang suggest near-term disappointment.
