
Entries from January 1, 2019 - January 31, 2019
UK money trends: continued weakness
 Simon Ward
 Post a Comment
UK money trends, while not deteriorating further, continue to suggest a weak economic outlook. GDP growth may fall below 1% this year even if a no-deal Brexit is avoided.
Six-month growth rates of real narrow and broad money (non-financial M1 / M4) were little changed in December and remain low by historical and international standards – see first chart.

Real money growth, as in Euroland, has been supported by a fall in inflation. In addition, Brexit and other risks may have boosted the precautionary demand for money, in which case current money growth rates may overstate near-term prospects for spending on goods and services.
Consistent with the latter story, retail investors sold mutual funds in the fourth quarter of 2018 for the first time since the EU referendum quarter in 2016 (and on a larger scale than then)*. Bank of England commentary, meanwhile, notes an above-average rise in household M4 holdings in December, driven by deposits in interest-bearing instant access savings accounts. A savings measure combining M4 holdings, mutual funds, National Savings and foreign currency deposits (“non-financial M4++”) is growing more weakly than the money aggregates – second chart.

Broad money trends have been supported from the credit side by steady expansion of bank and building society lending to the private sector. The latest Bank of England credit conditions survey, however, suggests a coming lending slowdown – third chart.

The OECD’s UK composite leading indicator continues to give a gloomy message for economic prospects, falling further in December – fourth chart**. The indicator is designed to predict the direction of GDP relative to trend, i.e. a decline signals below-trend growth, with trend currently estimated at 2.0% per annum. Four of the six components exerted a negative influence in December – consumer confidence, local share prices, expected services demand and interest rates***.

The above developments argue for the Monetary Policy Committee to shift to an easing bias at its upcoming meeting, although such a move appears unlikely.
*Source: Investment Association.
**Estimate based on data for five of six components. OECD data released on 11 February.
***The other components are car sales and expected manufacturing output.
Euroland money trends: false positive?
Recent Euroland money / credit news has been a mixed bag. The assessment here is that economic momentum is likely to remain weak but a region-wide recession will be avoided barring an external shock.
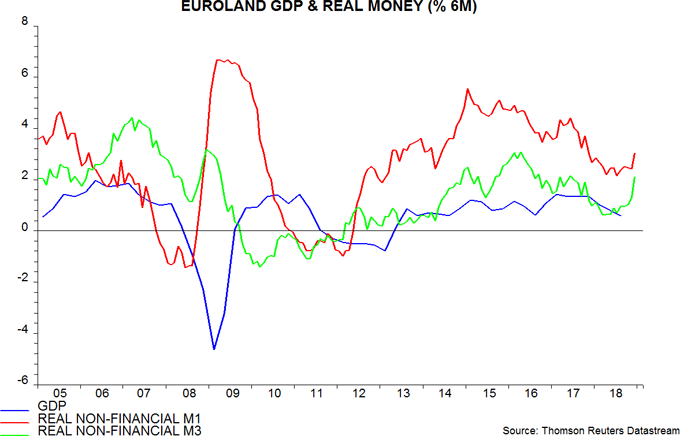
December money numbers released yesterday were, on the face of it, positive. Six-month growth rates of real narrow and broad money (i.e. non-financial M1 and non-financial M3*) rose notably, in the latter case to an 18-month high – see first chart. Allowing for a typical nine-month lead, the suggestion is that GDP growth will rebound in the second half of 2019.
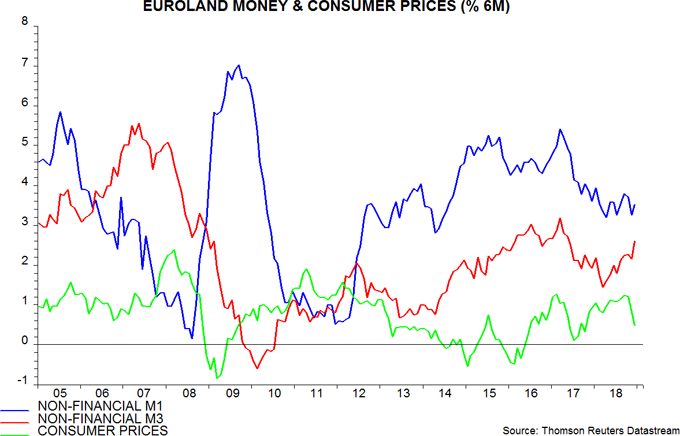
There are, however, grounds for caution. Stronger real narrow money growth has been driven by a slowdown in inflation, reflecting pass-through of weaker energy and food commodity prices, with nominal money trends stable – second chart. Inflation is likely to recover unless commodity prices weaken further, so real money growth could fall back.
The stronger performance of broad money, which has accelerated in nominal as well as real terms, could be argued to warrant optimism. Narrow money, however, has outperformed broad money as a leading indicator historically. Real broad money growth rose in 2010 and 2015 without a corresponding pick-up in narrow money; the economy subsequently slowed – first chart.
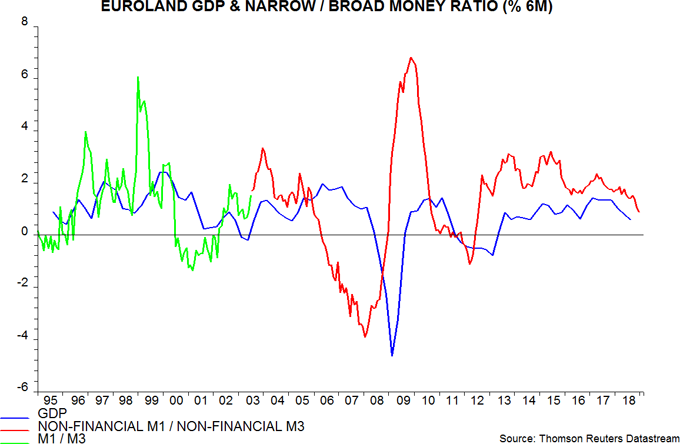
The ratio of narrow to broad money, indeed, has itself been a reasonable leading indicator of activity historically; this ratio continues to slow – third chart.
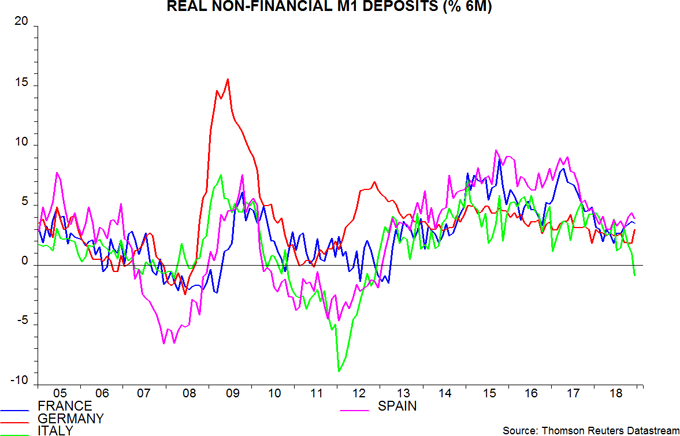
A further reason for caution is that narrow money trends may be starting to diverge across economies. Italian real non-financial overnight deposits contracted in the six months to December – fourth chart. A core / periphery divergence opened up before the 2009-10 and 2011-12 recessions. Euroland-wide GDP reacceleration is unlikely if the Italian economy is moving into recession.
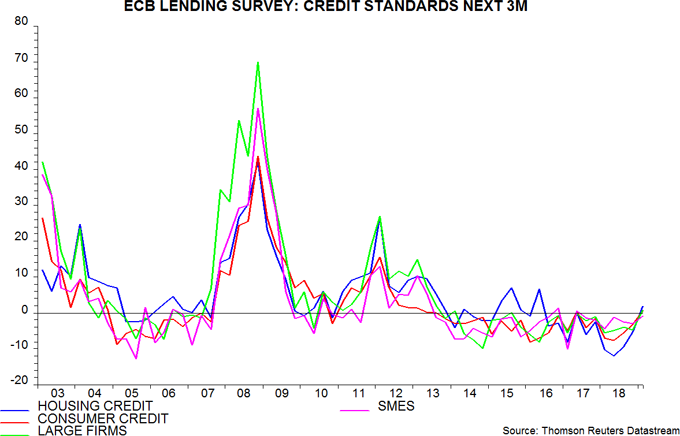
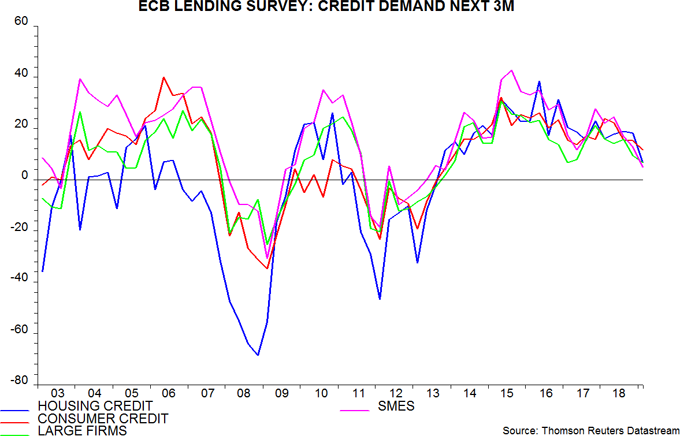
The ECB's fourth-quarter bank lending survey released last week, meanwhile, indicated less favourable expected trends in credit supply and demand – fifth and sixth charts. A slowdown in private sector lending could dampen broad money growth.
An interesting question for monetary anoraks is why broad money growth has picked up despite slowing QE. The counterparts analysis of the headline M3 measure shows that a fall in the government contribution to money growth, which incorporates the QE effect, has been more than offset by a shift from contraction to expansion in the banking system’s net external assets – seventh chart.
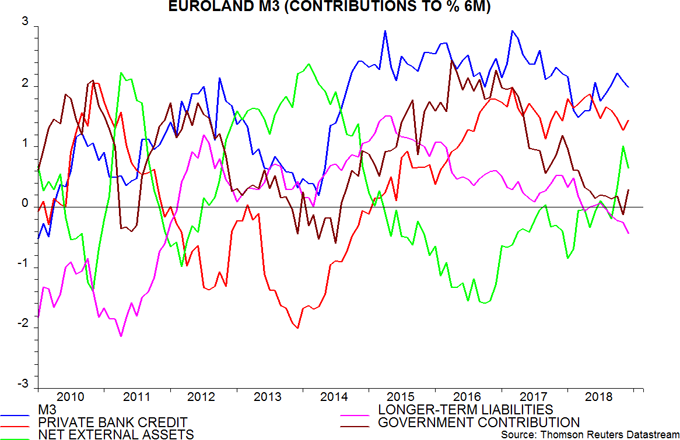
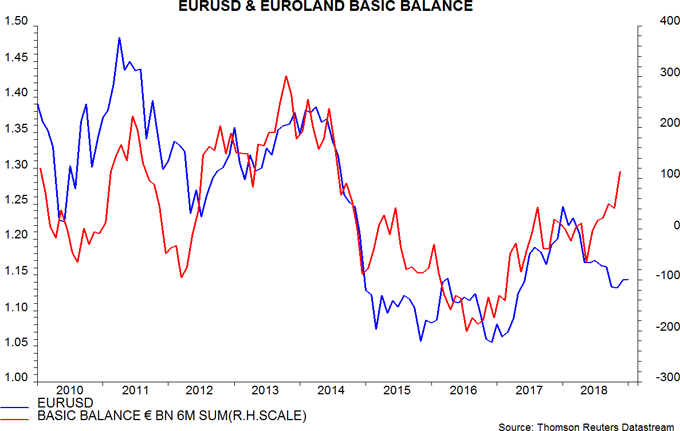
The interpretation here is that QE boosted domestic credit expansion but had little impact on broad money because “excess” liquidity was exported through the non-bank capital account of the balance of payments – the contraction of banks’ net external assets was the mirror-image of this capital outflow. With QE slowing, the outflow fell in the second half of 2018 and was smaller than the current account surplus, resulting in banks’ external position contributing positively to monetary growth. The stronger “basic” balance of payments position, i.e. current account plus non-bank capital account, could support the euro – eighth chart.
*Money holdings of financial institutions are excluded because they are volatile and unlikely to be relevant for assessing near-term prospects for spending on goods and services.
2016 replay?
Claims are being made that current economic / market conditions resemble those in early 2016.
The MSCI All-Country World Index (ACWI) fell by 20.2% in US dollar terms between May 2015 and February 2016 as the global economy slowed significantly, with the manufacturing PMI dropping to 50.0. Activity and equities, however, rebounded strongly over the remainder of 2016 as policy stimulus boosted the Chinese economy and the Fed paused rate hikes for 12 months.
The ACWI index fell by a slightly larger 20.7% from a January 2018 high to the Christmas low, while the manufacturing PMI weakened to 51.5 in December, with early flash results suggesting a further decline this month. Chinese policy-makers are easing again and markets are discounting only a 15% chance of a Fed rate rise this year, according to the CME FedWatch tool (as of yesterday).
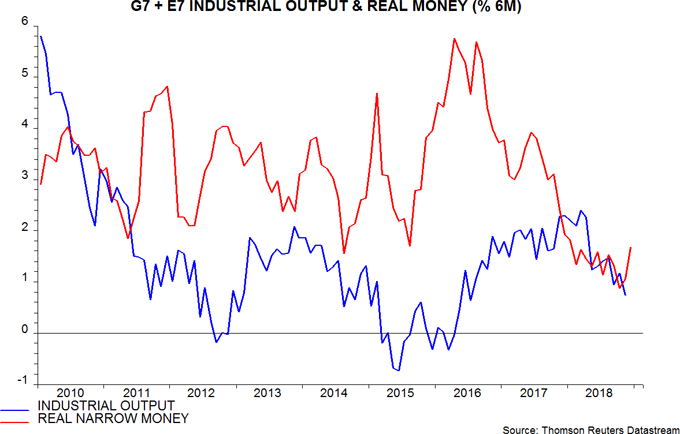
Commentaries here were positive about economic / market prospects in the first half of 2016 but current conditions differ in two important respects. First, global monetary trends are much weaker. Six-month growth of G7 plus E7 real narrow money bottomed in August 2015 and was moving up to a double-digit annualised pace as the equity market rally started in early 2016. Real money growth may have bottomed in October 2018 but a significant recovery has yet to unfold – first chart.
Secondly, the G7 stockbuilding or inventory cycle was bottoming out in early 2016 but – on the assessment here – is currently in the early stages of a downswing, which may extend into the second half of 2019.
A key cycle gauge is the annual change in G7 stockbuilding expressed as a percentage of GDP. This was still moving higher in the third quarter of 2018, the most recent data point, consistent with the cycle approaching a peak. It was, by contrast, significantly negative in the first quarter of 2016, having topped a year earlier – second chart.
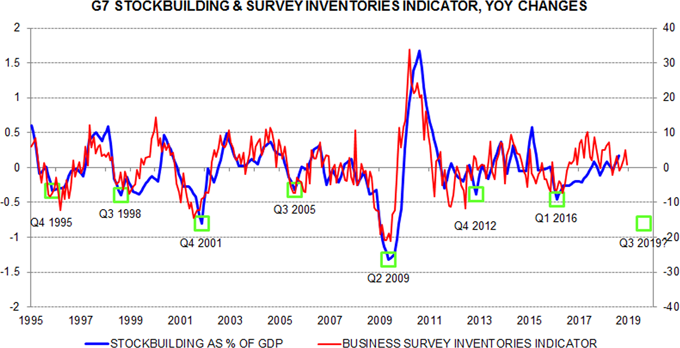
Business surveys provide a cross-check of the national accounts stockbuilding data and are more timely. As the chart shows, the annual change in a G7 survey-based indicator remained positive in December, supporting the assessment that the bulk of the cycle downswing lies ahead.
If the recent recovery in global real narrow money growth were to be sustained during the first half of 2019, and assuming that the current stockbuilding cycle is of average length (3.5 years), conditions could resemble those in early 2016 sometime during the second half of the year. A sustained monetary pick-up probably requires, at a minimum, the Fed to suspend “quantitative tightening”. Markets may have to weaken further to prompt such a shift.
Chinese money trends signalling further slowdown
Weak Chinese December money and credit numbers signal that policy easing has yet to translate into an improvement in economic prospects.
The preferred narrow and broad monetary aggregates here are M1 plus household demand deposits – i.e. true M1 – and M2 excluding deposits of financial institutions. Six-month growth of true M1 fell back towards the recent August low – see first chart.

Growth of M2 excluding financial institutions’ deposits rose to an 18-month high, a development some commentators may cite as a hopeful signal. The interpretation here is that broad money is being boosted by the contraction of the shadow banking system and a consequent shift of assets and liabilities onto banks’ balance sheet. The rise in bank deposits, that is, has probably been the counterpart of a larger fall in unrecorded shadow bank liabilities.
If the rise in broad money growth signalled stronger spending and activity, it would be expected to involve an acceleration of demand as well as time deposits, i.e. narrow money growth would also have recovered.
A similar divergence of broad and narrow money trends occurred in G7 economies in late 2007 / early 2008 as shadow banking systems collapsed – second chart. Narrow money correctly signalled coming economic weakness. A contraction in broad money was delayed until 2009-10, when shadow banking stabilised – economic activity was then recovering strongly.

Credit trends are consistent with the negative message from narrow money. Six-month growth of total social financing, which partially includes shadow credit, fell to a new low in December on the historical definition excluding local government special bonds (among other items) – first chart.
Sectoral money trends suggest weaker prospects for business than consumer spending. The six-month change in demand deposits of non-financial enterprises (NFEs) remained negative in December but household growth has recovered recently, possibly partly reflecting the impact of actual and scheduled tax cuts – third chart.

Real as well as nominal money trends are weak. Six-month growth of true M1 deflated by consumer prices reached a low in October, barely recovering in November / December – fourth chart. Allowing for a typical nine-month lead, this suggests a further slide in economic momentum into the third quarter.

Policy easing has accelerated in December / January. January money numbers will be make-or-break for hopes of a second-half economic rebound.
US C&I loan surge signalling stocks cycle downswing
A surge in US banks’ commercial and industrial (C&I) loans in late 2018 supports the view here that the stockbuilding cycle has peaked and will act as a drag on GDP growth in 2019.
Commercial banks’ loans and leases rose by 1.6% between September and December, or 6.5% at an annualised rate – the fastest since 2016. The pick-up reflected a 4.0% surge, or 17.1% annualised, in C&I loans, which account for about a quarter of the total – see first chart.

C&I loan growth is related to the level of stockbuilding, since companies typically draw down bank credit lines to finance an increase in inventories. Changes in stockbuilding, meanwhile, influence GDP growth. It follows that GDP growth depends on the rate of change of C&I loan growth, i.e. the C&I loan “impulse”.
The year-on-year change in three-month C&I loan growth rose to its highest since 2011 in December, suggesting that stockbuilding will have made a strong positive contribution to year-on-year GDP growth in the fourth quarter – second chart. The level of the impulse is consistent with a cycle peak, i.e. the stockbuilding contribution is likely to weaken and turn negative over coming quarters, with “multiplier” effects on other GDP expenditure components.

A "monetarist" perspective on current equity markets
In late 2016, the forecasting approach employed here – relying on monetary and cycle analysis – signalled that the global economy would grow strongly in 2017. A year ago, it suggested that a significant slowdown would unfold during 2018. The current message is that this slowdown is likely to extend and deepen, at least through mid-2019. A recovery in momentum is possible during the second half of the year but such a scenario requires confirmation from stronger monetary trends in early 2019.
The forecasting approach utilises the “monetarist” rule that turning points in real (i.e. inflation-adjusted) money growth lead turning points in economic growth, typically by around nine months. The narrow M1 aggregate – comprising currency in circulation and demand or overnight deposits – has provided more reliable signals historically than broader money measures. Global six-month real narrow money growth peaked in June 2017, falling sharply through February 2018. Allowing for the usual nine-month lead, this suggested that six-month industrial output growth would peak around March 2018 and trend lower into the fourth quarter. This forecast has played out – see first chart.

Real narrow money growth moved sideways after February 2018 before falling to a new low in October. The latter development implies that the six-month rate of change of industrial output is unlikely to reach a trough until around July 2019 (or later), i.e. the current economic slowdown is expected to intensify during the first half of the year.
The forecasting approach focuses on the direction of real money growth rather than its level. It may, however, be significant that the October level of global real narrow money growth was the weakest since the 2008-09 recession and only slightly higher than the low reached before the 2001 recession. This suggests that the current global economic slowdown will be more severe than the previous two since the 2008-09 recession, in 2011-12 and 2015-16.
Real money growth appears to have recovered in November and December, raising the possibility of a revival in economic momentum later in 2019. The judgement here is that monetary trends need to strengthen further in early 2019 to warrant adopting such a turnaround as a central scenario. There are some grounds for optimism: Chinese monetary and fiscal policy easing is expected to lift money growth, while recent oil price weakness is curbing global inflation, supporting real money trends. A significant pick-up in global real narrow money growth, however, probably requires a Fed policy shift – at a minimum, a halt to interest rate rises and “quantitative tightening”.
Supporting such a possibility, US money trends and other leading indicators suggest that US economic growth will undershoot Fed and consensus expectations in early 2019. Business narrow money holdings, in particular, have contracted in recent quarters, a development that historically has usually preceded a cut in business spending. A decline in the OECD’s US composite leading indicator, meanwhile, gathered pace through November 2018, implying below-trend and weakening GDP expansion – second chart.

A rise in “core” inflation above 2% could, in theory, force the Fed to continue tightening despite an economic slowdown. US and global core inflation, however, has moved sideways recently, defying predictions of a pick-up in response to faster wage growth – third chart. With oil price weakness pushing down headline inflation, and slower economic growth likely to ease labour market pressures, wage rises may moderate during 2019. If not, restrictive monetary conditions suggest that profit margins, rather than core prices, will take the strain.

The cycles component of the forecasting approach attempts to place current economic developments within a longer-term framework and acts as a cross-check of the monetary signals. There are three key cycles: the stockbuilding or inventory cycle, which has averaged 3.5 years in length in recent decades (measured from trough to trough); the business investment cycle, which has averaged 8.5 years, with a maximum of 10.5 years; and a longer-term housing cycle, averaging about 18 years. The cycles are global, though have been dominated by US developments in recent decades, and shorter-term cycles “nest” within longer ones, in the sense that troughs tend to coincide. The three cycles reached simultaneous lows in 2009, explaining the severity of the 2008-09 recession.
According to our cycle dating, the stockbuilding cycle reached subsequent lows in the fourth quarter of 2012 and the first quarter of 2016. The downswings into these lows contributed to the 2011-12 and 2015-16 global economic slowdowns. Based on the cycle’s 3.5 year average length, another trough could occur in the third quarter of 2019. A rise in stockbuilding during 2018 in G7 national accounts data is consistent with the cycle reaching a peak.
The difference from 2011-12 and 2015-16 is that the business investment cycle is also scheduled to enter a downswing. The last trough in this cycle coincided with a low in the stockbuilding cycle in the second quarter of 2009. With a maximum length in recent decades of 10.5 years, another trough is likely by the fourth quarter of 2019. The longer-term housing cycle, by contrast, is not scheduled to enter another downswing until the mid 2020s.
The stockbuilding and business investment cycles, therefore, are expected to exert a drag on global economic momentum during the first three quarters of 2019. A combined downswing would suggest a deeper economic slowdown than in 2011-12 and 2015-16, or even a mild recession – consistent with the message from monetary trends.
A reasonable working hypothesis is that both cycles will bottom out during the second half of 2019 and recover in 2020. The cycle analysis, that is, suggests that, if a recession is on the horizon, it is more likely to occur in 2019 than in 2020. The consensus view, by contrast, has been that any recession will be delayed until 2020-21 – in a September survey of US business economists, only 10% expected a contraction to begin in 2019, with 56% favouring 2020 and 33% 2021.
The consensus view appears to be informed partly by the observation that the US Treasury yield curve – i.e. the spread between the 10-year and two-year yields – inverted well in advance of most post-war recessions but has yet to do so. The current global economic slowdown, however, originated in China / Asia and spread to Europe, with spill-over to the US only now beginning. The Chinese government bond yield curve inverted in 2017, with a maximum negative spread in June of that year, consistent with maximum economic weakness in late 2018 / early 2019. The Chinese curve normalised in 2018, suggesting that China / Asia will lead any global economic recovery later in 2019 or in 2020. The US yield curve may prove to be a late or lagging indicator on this occasion.
The approach to assessing equity market prospects here emphasises the concept of “excess” money, defined as a positive differential between actual monetary growth and the rate of increase required to support economic expansion. Excess money is associated with excess demand for financial assets at their prevailing prices, and consequent upward pressure on those prices. By contrast, a negative differential – “deficient” money – is associated with weak markets.
Excess money cannot be measured directly but our analysis indicates that two simple proxy indicators would have been informative about market prospects historically – the differential between global real narrow money growth and industrial output growth, and the differential between real money growth and its long-run average. These two indicators are shown in the fourth chart, along with an index measuring the cumulative return on global equities relative to US dollar cash.

Between 1970 and 2017, global equities outperformed cash by 3.6% a year on average. This outperformance was concentrated in periods when the excess money indicators were positive – the excess return averaged 11.0% per annum or more during these phases. Equities, by contrast, underperformed cash on average when the indicators were negative, signalling deficient money.
Both indicators were consistently positive between June 2011 and November 2017 but one or other was negative in every month in 2018. The indicators, that is, suggested lowering equity market exposure and adopting defensive strategies in 2018, and have yet to signal a reversal.
A further reason for a defensive stance discussed in previous commentaries is the historical relationship of market returns with the stockbuilding cycle. Equities and other risk assets have tended to weaken in the 18 months leading up to a cycle trough, with gains concentrated in the first 18 months of upswings. The fifth chart shows our suggested cycle dating and the implied 18-month “risk-off” periods for markets (shaded). Six of the last seven such periods were associated with a crisis and / or major bear market in one or more assets.

On the working assumption that the next trough in the stockbuilding cycle will occur in the third quarter of 2019, another of these risk-off periods started in early 2018 and is scheduled to last for another seven or eight months. The pattern of returns since early 2018 – both across asset classes and within equity markets – has been consistent with previous risk-off phases, e.g. defensive sectors and “quality” have outperformed, US equities have been relatively resilient, the US dollar has strengthened and credit spreads have widened.
This approach suggests preparing for a major turning point in markets in the second half of 2019, possibly the third quarter, assuming that first-half evidence on stockbuilding and business investment is sufficiently weak, consistent with the two cycles moving towards lows. Equities would start to recover later in 2019, with the pattern of returns in the risk-off phase reversing. Such a scenario would be expected to be preceded by a rise in global real narrow money growth in the first half of 2019, resulting in the excess money indicators described earlier turning positive.
An extension of recent market trends in the first half of 2019, that is, could create buying opportunities. The cycle analysis suggests that longer-term investors should use any recessionary repricing of markets to add to inflation hedges. Overarching the three cycles discussed earlier is a longer-term inflation cycle averaging about 54 years, with peaks occurring in the last century in 1920 and 1975, and another scheduled for 2027-29. The next economic upswing, expected here to be under way in 2020, may prove to be the most inflationary since the 1970s. The upswing is likely to begin with unemployment rates considerably lower than in previous recovery phases in recent decades, while demographic trends are expected to place upward pressure on economic demand relative to supply. The global banking system, meanwhile, may emerge relatively unscathed from the current slowdown, and healthy capital / liquidity positions could support much faster bank credit expansion in the next upswing, creating the monetary conditions for a sustained inflation rise.
