Entries from January 1, 2018 - January 31, 2018
Global money trends still weakening
Global policy-makers are trumpeting “synchronised” economic growth. They should, instead, be worrying about synchronised monetary weakness, which is ringing alarm bells about economic prospects for later in 2018.
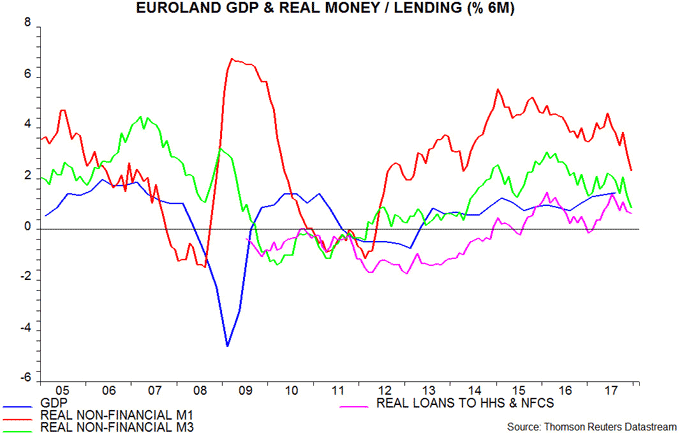
Euroland money numbers for December released today were soft. Six-month growth of real narrow money – defined as non-financial M1 deflated by consumer prices – fell further to its lowest level since 2014. Real broad money growth also declined sharply – see first chart.
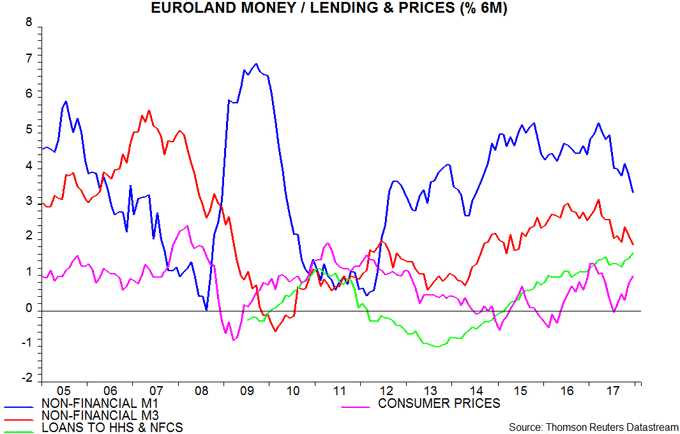
The real money slowdown reflects both lower nominal monetary expansion and a rise in six-month inflation. Six-month growth of nominal narrow money was also the lowest since 2014 last month – second chart.
Six-month real narrow money growth also fell further in December in the US, China and Japan. Our “global” measure covering the G7 and seven large emerging economies appears to have reached the bottom of its range since 2009 – third chart*.
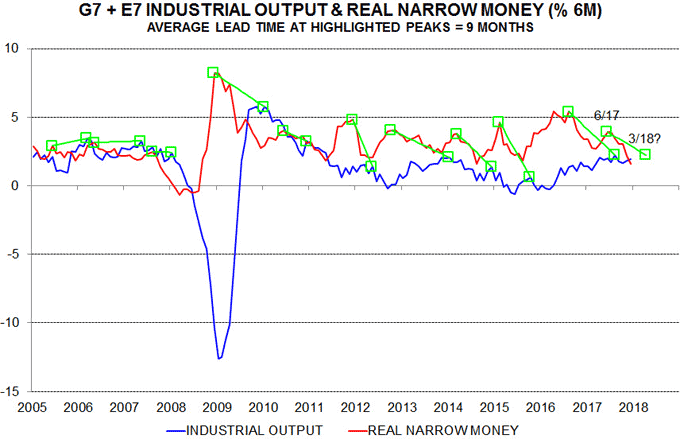
Global six-month real narrow money growth peaked most recently in June / July 2017 and has led turning points in industrial output growth by nine months on average in recent years (and over the longer term). This suggests a loss of economic momentum in the second quarter of 2018 extending well into the second half.
Weaker global monetary trends reflect significant US and Chinese policy tightening since late 2016. QE tapering by the ECB and BoJ, meanwhile, has slowed capital outflows and boosted the euro and yen – earlier currency falls played a key role in generating current Euroland / Japanese economic “strength”.
Will US tax cuts head off or mitigate a loss of global economic momentum? A significant stimulatory impact would probably be signalled by a rebound in US narrow money growth in early 2018. A negative view will be maintained here barring such a reversal.
*December monetary figures are available for countries accounting for 83% of the G7 plus E7 aggregate.
Is the UK labour market overheating?
Rising UK labour shortages seem to be feeding through to faster pay growth, supporting the arguments of MPC hawks such as Michael Saunders and suggesting shortening odds of an early further increase in interest rates.
The number of full-time employees rose by a very strong 0.9% in the three months to November, to stand 2.3% higher than a year before. Solid expansion had been suggested by an earlier increase in job vacancies, which climbed further in the three months to December.
The job openings or vacancies rate* of 2.9% is the highest on record in data extending back to 2001.
The CBI quarterly industrial trends survey released this week reported the highest percentages of firms experiencing shortages of general and skilled labour since 2004 and 1974 respectively – see first chart.

As well as strong labour demand, rising shortages reflect a smaller inflow of workers from the rest of the EU. Annual labour force growth, however, is only slightly below its average in recent years – second chart.

The unemployment rate was stable at 4.3% in the three months to November but a wider measure of underemployment including involuntary part-timers and those inactive but wanting a job fell further, to a new low in data back to 1992 – third chart.

Average weekly regular earnings of private sector employees rose by 2.5% from a year before in November, unchanged from October, but a three-month moving average grew by an annualised 3.5% in the latest three months – fourth chart. The average number of hours worked per week, moreover, has fallen recently, implying a stronger increase in hourly earnings. The earnings numbers continue to understate labour cost expansion because of rapidly-rising pension contributions and the apprenticeship levy.

*Vacancies as a percentage of employees plus vacancies.
UK public finances still surprising positively
UK public sector net borrowing is on course to undershoot the Office for Budget Responsibility’s £49.9 billion forecast for 2017-18, partly reflecting resilient tax receipts – consistent with the assessment here that economic growth is holding up.
12-month rolling borrowing fell to £39.4 billion in December, the lowest since January 2008 – see first chart. The December number was flattered by a one-off £1.2 billion credit from the EU, and the OBR expects self-assessment tax receipts over the remainder of 2017-18 to be significantly weaker than a year earlier – such receipts are forecast to fall by £3.1 billion for the year as a whole. Even so, the OBR appears to have been much too pessimistic about borrowing prospects in its November assessment – again.

Central government taxes and national insurance contributions rose by 4.2% in the first nine months of 2017-18 from a year before versus the OBR’s forecast of a 2.8% full-year increase – likely to be overshot even incorporating the projected decline in self-assessment receipts. Year-on-year growth of taxes and NICs has moved sideways since spring 2017, suggesting stable nominal GDP expansion – second chart.

Chinese money trends signalling weaker outlook
Chinese economic growth remained solid in late 2017, as had been suggested by narrow money trends through the summer. The latest narrow money numbers, however, were notably weaker – barring a swift reversal, the suggestion is that economic prospects are darkening.
Officially-reported real GDP rose by 6.8% in the year to the fourth quarter, beating a consensus forecast of 6.7%. Growth was supposedly equal in the first and second halves.
Nominal GDP, deflated by consumer prices, is probably a better guide to “true” activity*. Two-quarter growth of this measure peaked in the first quarter of 2017, fell back in the second and third quarters but staged a partial recovery in the fourth. A second-half slowdown had been predicted by six-month real narrow money growth, which fell significantly between August 2016 and January 2017. Real money growth, however, stabilised between January and September at a respectable level by historical standards, suggesting that economic momentum would remain solid into early 2018 – see chart.

The reassuring signal from narrow money trends through September contradicted forecasts that monetary and regulatory policy tightening would lead to a significant economic slowdown by end-2017. Followers of the “credit impulse”, in particular, have been too negative.
Real narrow money growth, however, fell further over October-December and is now in the lower half of its range in recent years. Unless money growth bounces back, the suggestion is that the economy will lose momentum in the spring / summer.
Narrow money trends usually lead house prices, industrial profits and producer prices – all three are likely to slow in early 2018. On past form, the authorities would be expected to respond by starting to reverse policy tightening. Such a policy reversal would be a surprise to the consensus and could give a short-term boost to commodity prices.
The risk is that policy-makers are now prioritising limiting credit expansion and financial risks and will be slow to step off the brakes, in which case monetary trends – and economic prospects – may continue to deteriorate in 2018.
*Consumer prices are an unsatisfactory proxy for the GDP deflator but this distortion may be less significant than the “smoothing” incorporated in official real GDP data.
A "monetarist" perspective on current equity markets
2017 was a bumper year for global markets because economic growth strengthened, core consumer price inflation flatlined and the monetary environment remained accommodative despite Federal Reserve policy tightening. Prospects for 2018 are less favourable in all three respects.
We expect the global economy to remain strong in early 2018 but to slow as the year progresses. This reflects two considerations. First, global six-month real narrow money growth peaked in June 2017 and fell significantly through November. Real money trends typically lead economic activity by between six and 12 months – we found an average lead time of nine months at growth turning points in G7 data extending back to the 1960s. This suggests that global six-month industrial output growth will peak around March 2018 and subside through August, at least – see first chart.

Secondly, an upswing in the US / global stockbuilding cycle has been an important driver of recent economic strength but we expect the cycle to top out in the first half of 2018 and act as a drag on growth later in the year and in 2019.
The original research into this cycle (by British economist Joseph Kitchin) indicated an average length of 40 months (i.e. measured from peak to peak or trough to trough). Consistent with this, the contribution of stockbuilding to the annual change in G7 GDP has reached a trough every 13-14 quarters on average over the past 20 or so years – second chart. The last trough occurred in the first quarter of 2016 and the growth contribution turned positive in the third quarter of 2017, the latest data point.
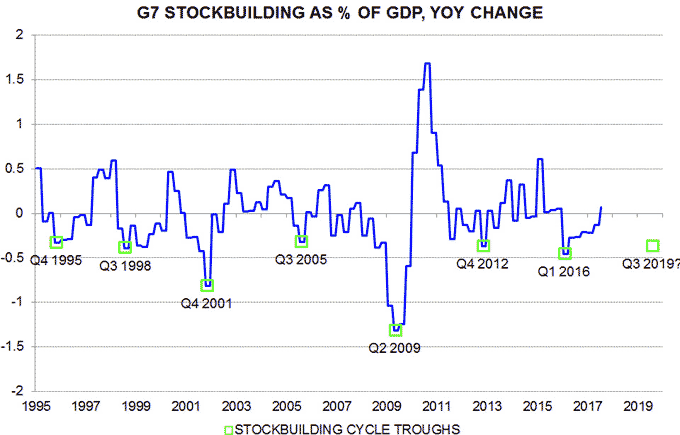
With the upswing nearly two years old, the cycle may be close to a peak, based on its average historical length. We expect the GDP growth contribution to rise further into early 2018 but to fade later in the year and turn negative in 2019 ahead of the next cycle trough.
Will US fiscal stimulus head off the economic slowdown suggested by monetary trends and the stockbuilding cycle? We are doubtful: while opinions vary widely, economists on average expect an impact on US GDP growth in 2018 of about 0.4%, which would suggest a marginal influence on global prospects.
As well as solid economic growth, strong market performance in 2017 reflected stable core (i.e. ex. food and energy) consumer price inflation and resulting limited monetary policy tightening. Central banks may face a greater inflation challenge in 2018.
G7 core producer price inflation has picked up over the past 18 months as firms have passed on rising input costs and widened margins in response to strong demand. Core producer price trends often lead consumer prices – third chart.

Growing labour shortages, meanwhile, threaten to boost wage growth and slow productivity performance. In the US, the unemployment and job openings (vacancies) rates have almost converged, a rare occurrence historically that has always presaged a pick-up in unit labour cost growth.
Labour markets are also tight in Germany, the UK and particularly Japan, where the job openings rate has opened up the largest gap with the unemployment rate since 1974.
A rise in unit labour cost growth would push up core inflation unless firms took the hit on margins. Central banks would probably need to accelerate policy tightening to force them to do so.
China could be an exception to a general trend towards tighter monetary policies in the first half of 2018. The authorities have already moved to a modestly restrictive stance and annual narrow money growth has fallen significantly since late 2016. Money trends lead house prices, suggesting that the latter will slow further in early 2018 – fourth chart. Monetary policy was eased on the last three occasions that annual house price inflation fell to zero.
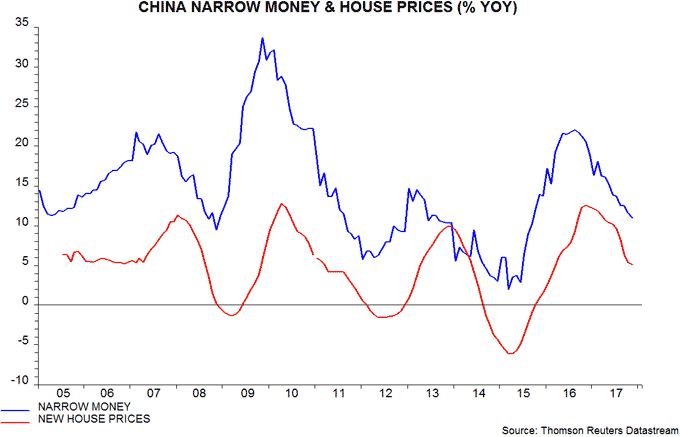
Any policy reversal in China could give a further short-term boost to commodity prices, which would add to global inflation concerns.
In addition to expecting a less favourable growth / inflation mix in 2018, we judge that monetary conditions are no longer conducive to asset price appreciation. Our historical research found that bouts of equity market weakness were usually preceded by G7 annual real narrow money growth falling below its long-run average of about 3% or declining sharply (i.e. by 3 percentage points within six months). A strategy of switching into cash under such conditions would have significantly outperformed buy-and-hold – fifth chart.

G7 real narrow money growth has fallen moderately since late 2016 but remains well above the 3% long-run average – neither condition, therefore, has yet been satisfied. G7 trends, however, are no longer an adequate proxy for global monetary conditions, given the growing weight of China and other emerging economies. Our global annual real money growth measure peaked at nearly 10% in late 2016 and recently fell below its long-run average of about 6%. The monetary backdrop for equities and other risk assets, therefore, may be neutral at best.
Two further reasons for a more defensive stance are slowing QE and the historical correlation of market returns with the stockbuilding cycle. The 12-month running total of purchases of government and agency securities by the G4 central banks peaked in March 2017 and will fall steeply in 2018, based on announced plans – sixth chart. This slowdown could weaken monetary trends, while prior declines in 2010 and 2014 preceded equity market set-backs.

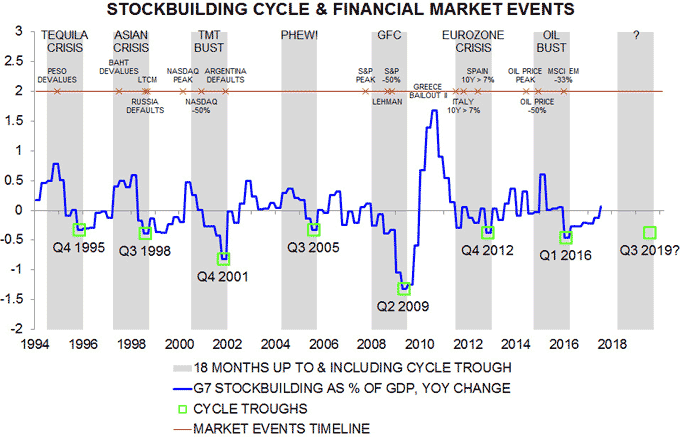
The position of the stockbuilding cycle, meanwhile, appears to be an important indicator of market environment, according to our research. Markets tend to be in “risk-on” mode during the cycle’s upswing phase but the 18-month period leading up to a trough is often characterised by selective or general asset price weakness and “crises” – seventh chart. Assuming that the current cycle is of average length, another 18-month “dark” period may begin in the first half of 2018.
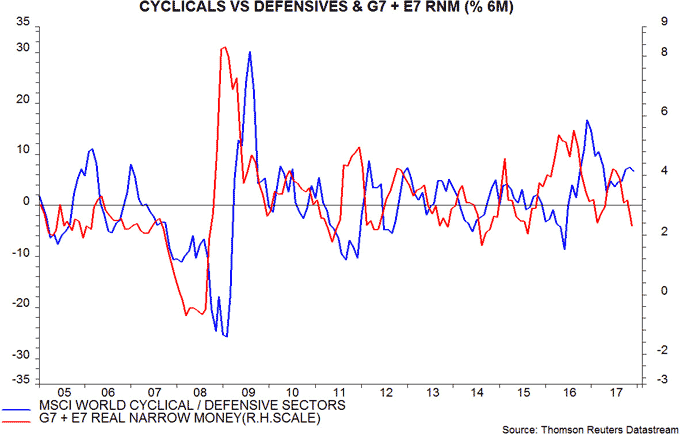
MSCI World cyclical equity market sectors outperformed defensive sectors by 30% between mid-2016 and end-2017. Outperformance is normal during stockbuilding cycle upswings but defensives usually regain ground during the downswing phase. The recent fall in global real narrow money growth also argues for increasing defensive sector exposure – eighth chart.
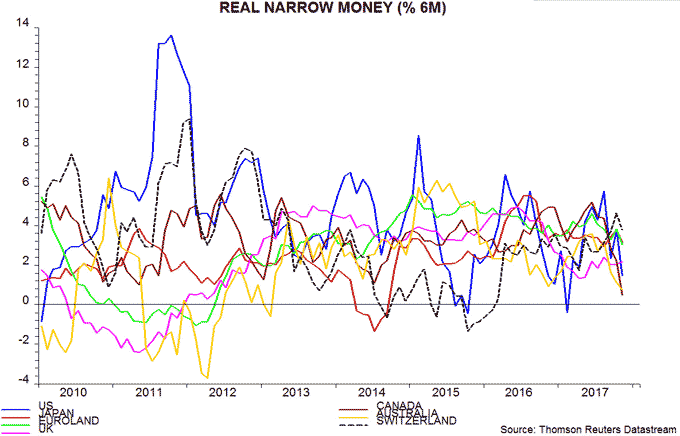
Real money growth has declined in the US and Euroland as well as China, and is particularly weak in Canada and Australia; it has strengthened in Switzerland, moved sideways in Japan and recovered slightly in the UK – ninth chart. This suggests adding to equity market exposure in the latter three markets while reducing the former group.
E7 real narrow money growth was above the G7 level in 2016 / early 2017, arguing for an overweight position in emerging markets, but the latest numbers are similar. Emerging equities typically underperform during the downswing phase of the stockbuilding cycle.
UK data revisions positive, money trends stable
The Office for National Statistics presented a pre-Christmas gift to economic optimists by upgrading GDP numbers for 2016-17 while indicating that the balance of recent growth has been more favourable than previously reported. Current monetary trends suggest that economic expansion will remain respectable in 2018.
The revisions boosted annual GDP growth in the first three quarters of 2017 by 0.3%, 0.4% and 0.2% respectively. Full-year growth is now on course to be 1.8% – significantly better than a consensus forecast of 1.2% at the start of 2017*.
From the expenditure side, the upgrade reflected stronger net exports and fixed investment, which offset weaker household consumption than previously reported.
From the output side, industrial and construction sector growth was revised higher, with services expansion unchanged.
According to the new data, the improvement in net export performance in 2017 was impressive and has offset a significant slowdown in household consumption, with business investment growth modest but stable – see first chart. Overall investment growth has been slightly higher because of a strong housing contribution.

The rise in net exports has probably been driven by the divergence between strong growth in foreign markets and subdued domestic demand, rather than a competitiveness boost from the fall in sterling. Exporters have adjusted sterling prices to offset most of the impact of the depreciation: the deflator for exports of goods and services rose by 10% between the first quarter of 2016 and third quarter of 2017 versus a 12% fall in the effective exchange rate over the same period,
Bank of England monetary data for November released yesterday suggest that economic expansion will continue at around its recent pace through summer 2018. Six-month growth rates of real (i.e. consumer price-deflated) narrow and broad money have been little changed since June 2017, having bottomed in April – second chart.

The rise in real narrow money growth since April 2017 reflects a modest recovery in the household component, which had weakened significantly in late 2016 / early 2017, warning of a consumption slowdown. This recovery suggests that consumer prospects are improving at the margin.
Real narrow money holdings of private non-financial corporations (PNFCs), meanwhile, continue to grow solidly, suggesting stable or stronger business investment expansion.
As in 2017, construction activity may support overall investment. New construction orders surged by 37% in the third quarter of 2017, reflecting the awarding of HS2 contracts. The associated construction is not scheduled to start before late 2018 but non-infrastructure orders also rose, while the new orders component of the construction purchasing managers’ survey increased to a seven-month high in December.
The signal that overall growth will hold up in 2018 is supported by a narrowing of the two-year swap spread, which has been an inverse leading indicator of economic performance historically – third chart.
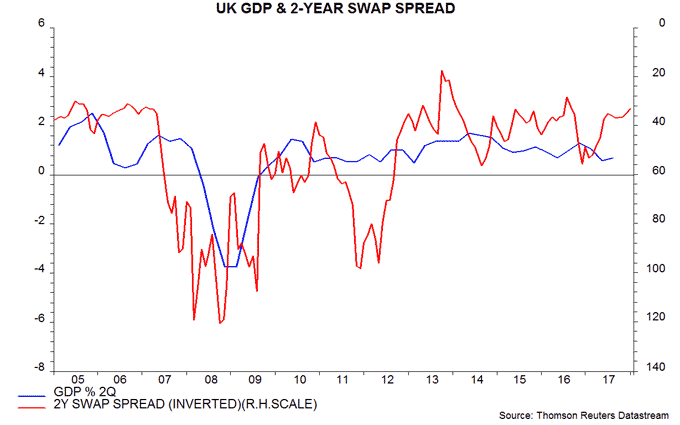
These developments suggest upside risk to the current consensus forecast of only 1.4% GDP growth in 2018.
*Consensus forecast from Treasury’s monthly survey.

