Entries from January 1, 2017 - January 31, 2017
UK money trends turning cautionary
Strong UK monetary expansion before and after the June EU referendum signalled that economic growth would remain solid in late 2016 / early 2017. December money numbers released today were better than November’s but trends have clearly weakened, particularly in real terms, suggesting an economic slowdown during the second half of 2017.
Some economists of a monetarist persuasion may cite still-solid annual growth of the Bank of England’s broad money measure, M4ex, as a reason for optimism about economic prospects. M4ex growth rebounded from 6.7% in November to 7.2% in December – not far below September’s peak of 7.7%.
The annual M4ex increase, however, continues to be inflated by a significant rise in money holdings of fund managers and other financial institutions earlier in 2016 – such holdings are of limited relevance for assessing near-term spending prospects. The preferred broad money measure here is non-financial M4, comprising holdings of the household sector and private non-financial corporations (PNFCs). This measure rose an annual 5.8% in December.
Annual growth rates, moreover, are slow to reflect changes in trend. The six-month increase in non-financial M4 eased to 5.2% at an annualised rate in December; three-month growth was just 3.0%. The narrow non-financial M1 measure also slowed significantly in late 2016 – see first chart.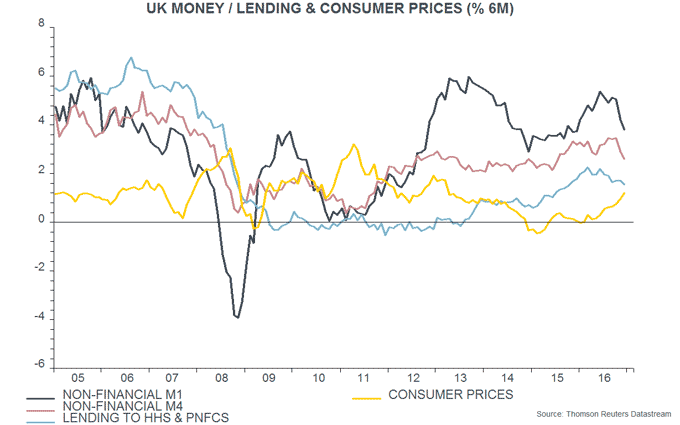
Monthly growth of non-financial M4 recovered from 0.1% to a modest 0.3% in December. Non-financial M1 had been unchanged in November and rose 0.5% last month.
Economic prospects are related to real rather than nominal monetary trends. With consumer price momentum rising sharply at end-2016, six-month growth of real non-financial M1 fell to its lowest level since December 2012; real non-financial M4 growth was the lowest since January 2014 – second chart.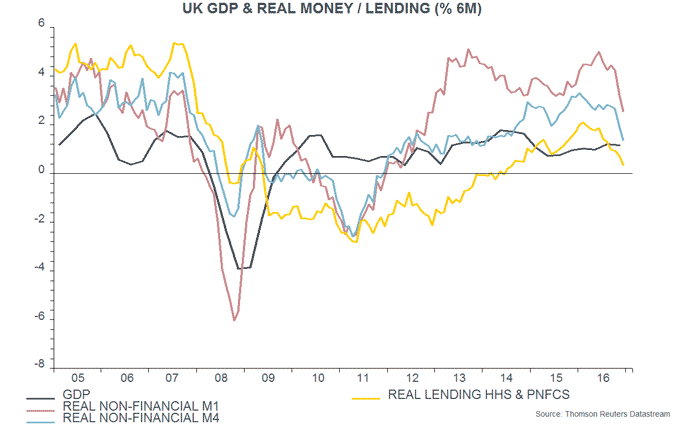
The six-month real growth rates remained solid until October 2016, suggesting respectable GDP expansion during the first half of 2017, allowing for an average nine-month lead from money to activity. Together with a positive carry-over effect from late 2016 strength, this could allow annual average GDP growth in 2017 to reach 2% even incorporating a second-half slowdown.
Household and corporate (PNFC) money trends are informative about prospects for consumer spending and business investment respectively. Six-month growth rates of real household and PNFC M1 were similar in December but household expansion has fallen significantly since October; slower GDP growth may reflect, at least initially, fading consumption strength rather than weaker investment – third chart.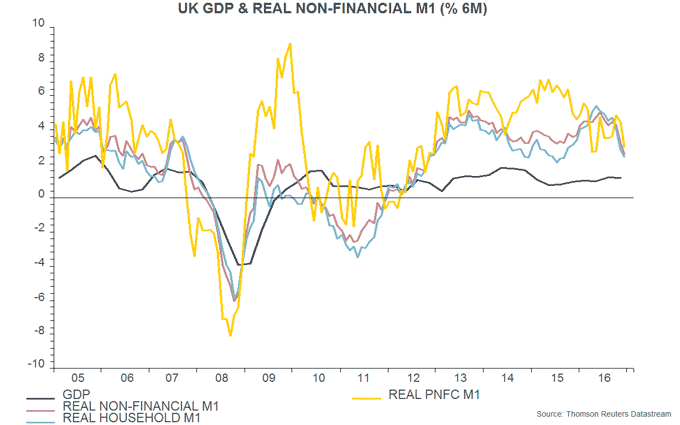
Strong UK economy reflects pre-referendum monetary trends
The UK economy retained strong momentum in late 2016, with GDP provisionally estimated to have grown by 0.6% from the third quarter, or 0.7% excluding oil and gas extraction. An upside surprise had been suggested by November services turnover figures discussed in a post a fortnight ago. Services output expanded by 0.8% for the quarter as a whole, essentially accounting for the rise in GDP. Industrial output was unchanged, while construction output rose 0.1%. Within industrial output, however, a 0.7% rise in manufacturing was offset by a 6.9% fall in mining and quarrying, reflecting lower oil and gas production.
At the time of its December meeting, the MPC believed that GDP had expanded by 0.5% in the third quarter and projected a 0.4% fourth-quarter rise. With third-quarter growth since revised up to 0.6%, the rise in GDP over the two quarters since the Brexit referendum has been 0.3 percentage points higher than the MPC expected as recently as last month.
Monthly sectoral output estimates incorporated in the quarterly calculation imply that the December level of GDP was 0.25% above the fourth-quarter average, suggesting a solid base for first-quarter growth (although these estimates can be unreliable).
Robust economic growth during the second half of 2016 was predicted by faster real (i.e. consumer price inflation-adjusted) narrow and broad money expansion in late 2015 / early 2016; money fluctuations typically lead activity by between six and 12 months – see chart. Real money trends remained solid through October but growth rates dropped off in November. December data next week will be important for assessing whether economic prospects for later in 2017 are dimming.
A statistical model of the MPC’s “reaction function” estimated on data since its inception in 1997 suggests that the Committee should be close to raising rates, based on recent upside data surprises and financial market developments. The model “predicts” that up to four members will vote to reverse the August quarter-point rate cut next week. As well as today’s GDP news, the model is influenced by the strength of purchasing managers’ surveys and sharp rises in price expectations in the EU Commission consumer survey and the CBI industrial trends survey.
Today’s MPC, of course, is a different animal, with Bank of England Governor Mark Carney more dominant in decision-making than his predecessors, partly reflecting his control of “forward guidance”. Mr Carney is likely to shift the Committee to a tightening bias next week but will resist pressure for an early rate rise, which would amount to an admission that his August easing package was misguided.
Global capital flows turning less US dollar-positive
Super-loose monetary policies resulted in the combined net outflow of portfolio capital from the Eurozone, Japan and China – disguised or hidden in China’s case – surging to a record in 2016. With monetary stimulus likely to be wound down, the outflow may slow in 2017, casting doubt on forecasts of US dollar strength / US asset price outperformance.
The Eurozone, Japan and China must, by definition, run capital account deficits by virtue of their current account surpluses – ignoring errors and omissions, credits and debits must sum to zero in the balance of payments accounts. The current account surpluses in the year to the third quarter of 2016 amounted to 3.2%, 3.6% and 2.4% of GDP respectively. The Eurozone and Japanese surpluses were up from 3.1% and 2.7% of GDP in the prior 12 months, while the Chinese surplus was down from 3.0%.
The net outflow of portfolio and other investment was, however, much larger than these surpluses. The Eurozone portfolio deficit surged to a record 5.1% of GDP in the year to the third quarter. Japan’s deficit was 6.2% of GDP, following 6.4% in the year to the second quarter, a level exceeded only after the financial crisis – see first chart.
Chinese controls on portfolio flows have diverted most of the capital exodus into the “other investment” account and errors and omissions. The combined portfolio, other investment and errors and omissions deficit was 5.4% of GDP in the year to the third quarter. This was, however, down from a peak of 6.7% in the year to the fourth quarter of 2015 – first chart.
According to monetary theory, the balance of payments “basic balance” – the sum of the current account and the direct and portfolio investment accounts – is determined by the difference between domestic credit expansion (i.e. the growth of bank lending to the domestic public and private sectors) and growth in domestic residents’ demand to hold bank liabilities (i.e. broad money plus non-monetary liabilities such as bank bonds). Faster expansion of domestic credit than demand to hold bank liabilities creates “excess” liquidity that is, in effect, exported by running a basic balance deficit.
Domestic credit expansion has been boosted in the Eurozone and Japan by QE, and by state borrowing from the banking system in China. The demand to hold bank liabilities, by contrast, has been suppressed by low interest rates and inflation. A blow-out in basic balance deficits has been necessary to restore monetary equilibrium. The current account positions are strong in all three cases, reflecting competitive currencies and domestic saving-investment surpluses. Portfolio and other financial investment flows, therefore, have borne the main burden of adjusting the basic balance to compensate for “excess” domestic credit expansion.
In the Eurozone’s case, for example, QE has contributed to annual growth of domestic credit extended by monetary financial institutions (MFIs) rising to 4.2% in November 2016, the fastest since 2009. Domestic holdings of MFI liabilities, however, increased by only 1.7% in the year to November, with broad money M3 growth of 4.8% offset by a withdrawal of funds from longer-term bank bonds and time deposits – second chart.
In value terms, therefore, the 12-month sum of the gap between domestic credit expansion and growth of domestic liabilities was €338 billion in November, having reached a record €389 billion in October. This compares with a basic balance deficit of €370 billion in the year to November – third chart.
The ECB has announced a reduction in the pace of QE from €80 billion per month to €60 billion from April, while inflation is likely to exceed its forecast in 2017, suggesting further tapering (announced or actual) later in the year. The PBoC, similarly, has started to wind down stimulus, this week increasing a key interest rate amid solid economic data and surging producer prices. The BoJ remains committed to its zero target for the 10-year JGB yield for now but this may be achievable with a slower pace of QE against a backdrop of stable US Treasury yields and a firmer yen.
Unless private credit demand and / or supply pick up to offset reduced policy stimulus, therefore, domestic credit expansion may slow in all three economies. The demand to hold broad money and other bank liabilities, meanwhile, may strengthen in line with faster nominal GDP expansion. The domestic credit / liabilities growth gap, therefore, may narrow, implying an improvement in basic balances, probably driven by a reduced net outflow of portfolio and other financial investment. Such a slowdown could be associated with upward pressure on the euro, yen and renminbi against the US dollar as well as stronger relative asset price performance.
Chinese GDP inflation surge arguing for tighter policy
Chinese nominal GDP growth strengthened significantly in late 2016 and monetary trends suggest a further pick-up through the first half of 2017, at least. Concern about rising inflation is expected here to be reflected in gradual monetary policy tightening that may boost the renminbi in the absence of US protectionist actions.
Annual growth of nominal GDP has risen from a low of 6.0% in the third quarter of 2015 to 9.9% in the fourth quarter of 2016, a three-year high. The increase has been driven by the GDP deflator, with annual growth of real GDP stable at 6.7-6.9% over this period, according to National Bureau of Statistics (NBS) data – see first chart.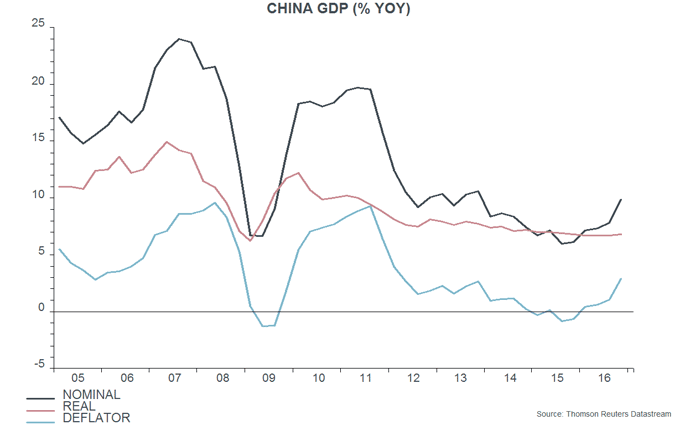
The stability of annual real GDP growth, however, conceals a significant economic slowdown in 2015 / early 2016 followed by a marked recovery. Two-quarter real GDP expansion* fell to a low of 2.8% in the first quarter of 2016 (equivalent to annualised growth of 5.7%) but rebounded to 3.7% (7.6% annualised) in the third quarter, remaining strong at 3.5% (7.2%) in the fourth quarter. This slowdown and recovery were foreshadowed by weakness in inflation-adjusted money measures in 2014 that reversed in 2015-16 – second chart.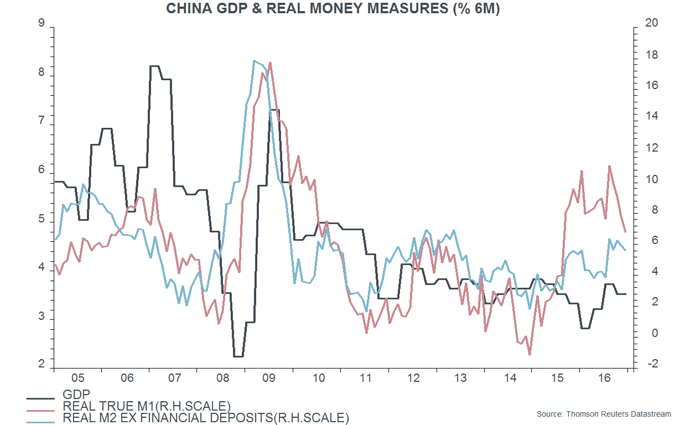
Annual growth rates of narrow and broad money may have peaked out in late 2016 but usually lead nominal GDP growth by six to 12 months, suggesting that the latter will rise further into the second quarter of 2017, at least – third chart. GDP inflation is likely to continue to drive the pick-up, although economic growth will probably also firm.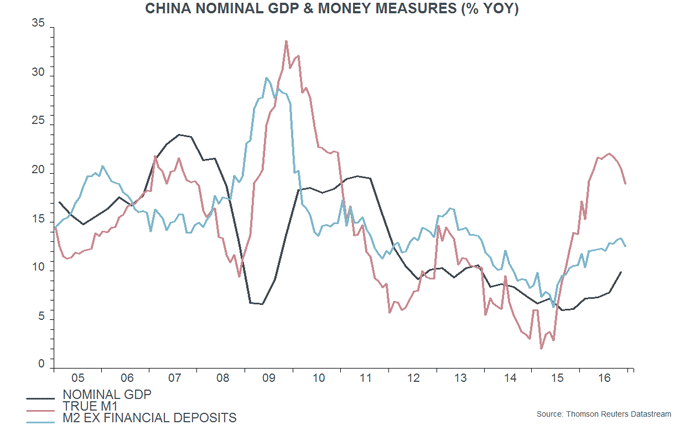
Consumer price inflation was 2.1% in December but may narrow the gap with rising GDP deflator inflation – 2.9% in the fourth quarter, the highest since the first quarter of 2012 – as the year progresses. The authorities will want to avoid an overshoot of the 3% target and may continue to tighten monetary policy to head off this prospect. Tighter monetary conditions may be associated with a slowdown or reversal of capital outflows and a consequent stabilisation or recovery in the renminbi – see previous post.
*Derived from NBS quarter-on-quarter seasonally-adjusted growth data.
UK inflation: above-consensus forecast on track
A post in October suggested that UK annual consumer price inflation would move above 3% by mid-2017. Such a scenario remains plausible.
CPI inflation rose from 1.2% in November to 1.6% in December. The increase was exaggerated by a statistical quirk related to air fares that should unwind in January. The December rate would have been 1.5% in the absence of this effect*.
“Core” inflation – excluding energy, food, alcohol and tobacco – has risen from a low of 0.8% in June 2015 to 1.6% in December, or 1.5% excluding the air fares quirk. Core inflation is expected here to reach around 2% by mid-2017. The proximate cause is pass-through of higher prices of imported goods due to sterling weakness – manufactured import prices rose by an annual 11% in the year to November. The CPI core goods index has yet to reflect this surge, increasing an annual 0.3% in December.
The deeper driver is a loosening of monetary conditions from 2011: annual growth of broad money** has risen from below 2% then to 6-7% recently, and swings in monetary growth have consistently led major core inflation swings since World War Two, typically by two to three years – see first chart*** and previous post. This relationship implies that core inflation will remain under upward pressure later in 2017 and in 2018.
The forecast of 3%+ CPI inflation by the summer also incorporates a significant boost from surging commodity prices. The S&P GSCI commodity price index in sterling terms is currently 60% above its year-ago level, and similar rates of increase historically have resulted in a wedge of at least 1 percentage point opening up between headline and core inflation – second chart. 
Food as well as energy prices should be boosting headline CPI inflation by the summer, with strong pipeline pressure evident in producer food input prices – third chart.
*Air fares are seasonally strong in December and rose by 49% last month versus 46% in December 2015. Their weight in the index increased from 6 to 8 parts per thousand between December 2015 and December 2016. The weighting increase boosted the monthly impact on the CPI by 10 basis points last month relative to December 2015 (i.e. 46% times 0.002). Air fares usually reverse December strength in January so the effect should unwind this month.
**Non-financial M4.
***The chart uses core RPI rather than CPI inflation because of its much longer history.
Chinese economy accelerating, money trends still positive
Monetary trends and leading indicators suggest that Chinese economic growth will exceed consensus expectations in the first half of 2017, supporting the view here that monetary policy will tighten, relieving downward pressure on the renminbi.
The OECD yesterday released November data on its country leading indicators. Six-month growth of the Chinese indicator* rose further and has now diverged significantly from industrial output momentum, signalling a likely catch-up of the latter – see first chart.
December monetary numbers released today, meanwhile, were solid. The additional detail is not yet available to calculate the preferred narrow and broad aggregates here – M1 plus household demand deposits (“true M1”) and M2 excluding financial sector deposits (the latter being volatile and largely unrelated to near-term spending decisions). Six-month growth rates of the headline M1 and M2 measures, adjusted for consumer price inflation, fell slightly from November – second chart. Real narrow money growth may have peaked in August 2016, suggesting a top in six-month industrial output expansion around May, allowing for an average nine-month lead. The lead time at the prior trough, however, was longer than nine months, hinting at a later peak in economic momentum**. The levels of real money growth, meanwhile, remain solid – there is no signal of a significant slowdown later in 2017.
In contrast to monetary trends, six-month growth rates of real bank loans and total social financing rose in December, the latter to its fastest since January 2016 – a further reason, along with strengthening economic news and rising inflationary pressures, for expecting monetary policy to tighten.
*The indicator has six components: production of steel, motor vehicles, fertilisers and buildings; the overseas orders index of the PBoC 5000 enterprise quarterly survey; and stock exchange turnover.
**The six-month change in real narrow money bottomed at end-2014, more than a year ahead of pick-ups in leading indicator and industrial output growth.


