Entries from January 1, 2015 - January 31, 2015
Eurozone money trends still upbeat
Eurozone six-month real money growth continued to strengthen in December, supporting the optimistic view here of economic prospects – see also yesterday’s leading indicator report.
The monthly rise in narrow money M1 slowed to 0.3% last month, while the broad M3 measure was unchanged from November. Six-month growth rates, however, remained solid, at 4.8% and 2.2% respectively (9.7% and 4.5% annualised), reflecting strong gains in prior months.
Real growth was boosted by an energy-driven fall in consumer prices in December. Six-month real M1 expansion is now the highest since October 2009, and M3 expansion since February 2009. Real bank lending is also finally growing – see first chart. (The money supply leads the economic cycle, while lending is coincident / lagging.)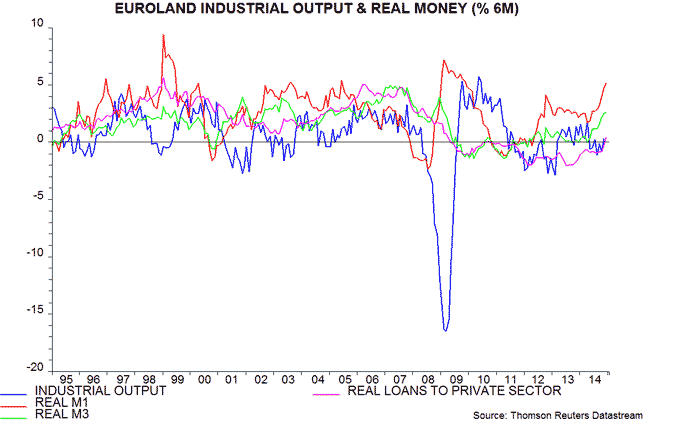
Sceptics argue that real money acceleration due to falling prices is not a positive economic signal. There are two responses. First, the recent pick-up in real money growth mainly reflects faster nominal expansion rather than weaker prices – second chart. Secondly, economic growth has strengthened after previous occasions when real money has been boosted by a decline in prices. A surge in real M1 in 2008-09, for example, was also partly due to a fall in energy costs but correctly signalled a strong economic rebound in 2009-10.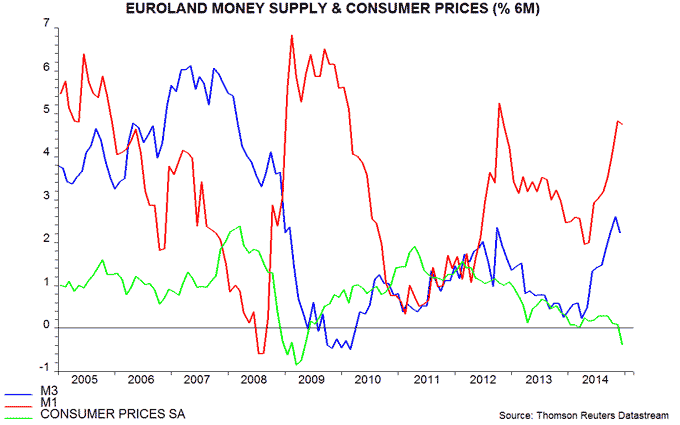
The country deposit breakdown shows solid real narrow money trends across the big four economies. Six-month growth in real M1 deposits remains fastest in Spain; Germany had been lagging but caught up with France last month – third chart.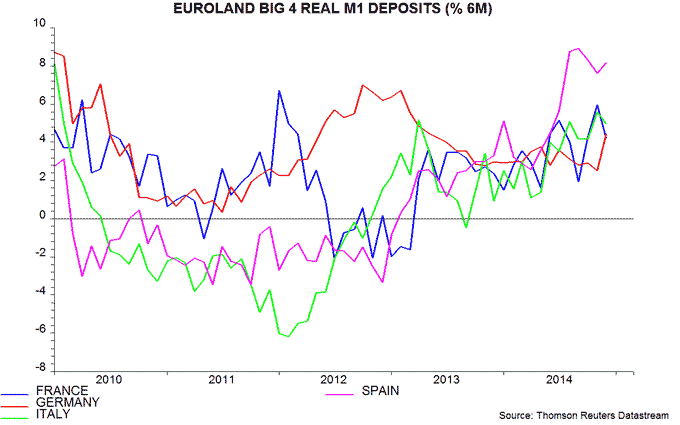
Previous posts argued that QE had limited impact on monetary growth in the US, UK and Japan because it partly involved banks swapping securities for idle reserves at the central bank. The coming ECB programme could be more effective because rising excess reserve holdings will be penalised via the negative deposit facility rate, giving banks a greater incentive to expand lending.
In other Eurozone news today, German unemployment on an internationally-standardised definition fell to a new post-reunification low of 4.8% in December, with a corresponding further rise in the job openings (vacancies) rate. The labour market in Germany appears tighter than in the US / UK, suggesting greater upward pressure on wage growth – fourth chart.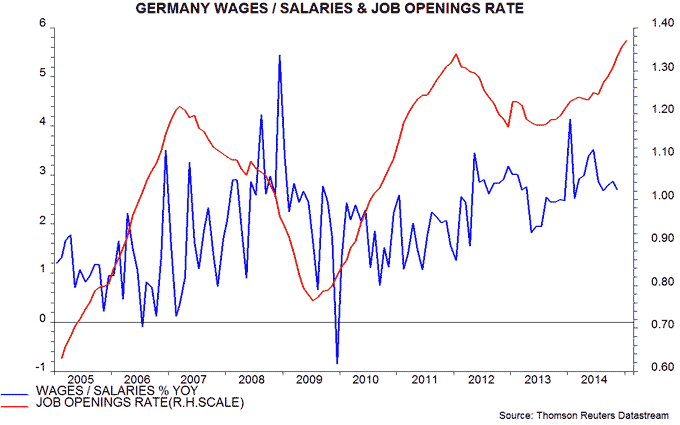
Eurozone leading indicator still rising
The Eurozone longer leading indicator calculated here rose further in December, suggesting that economic growth will rise into mid-2015, at least – see first chart.
The indicator uses the same components as the OECD’s Eurozone leading indicator but is calculated independently and is designed to predict turning points in the six-month rate of change of industrial output*. The December reading is based on partial data but the direction of change is unlikely to be revised. The further increase last month partly reflects recent stronger business survey results in Germany and France**.
The leading indicator turned negative in early 2014 but has been recovering since mid-year, regaining positive territory in September. It usually leads economic momentum by about half a year so the recent improvement in Eurozone coincident data, reflected in a positive reading of the Citigroup surprise index, is occurring on schedule.
The indicator’s revival confirms the hopeful message from monetary trends. Real (i.e. inflation-adjusted) narrow money M1 also leads industrial output by about half a year and its six-month growth reached a five-year high in November – second chart. (December money numbers are released tomorrow.)
The combination of strong real money growth, perhaps to be boosted further by sovereign QE, with weak but rising industrial output expansion suggests a favourable backdrop for Eurozone risk assets.
*The OECD leading indicator predicts the level of output relative to trend rather than growth.
**The December reading of the indicator incorporates January data where available in the calculation of trends in the components.
US slowing on schedule, monetary trends reassuring
A post in September noted that six-month growth in US real narrow money growth had fallen sharply, suggesting a loss of economic momentum in early 2015. This scenario seems to be playing out: Citigroup’s US economic surprise index turned negative at the end of last week after a five-month positive run. The Eurozone index, meanwhile, has recovered and is now above the US level – see first chart.
Should investors worry about US economic weakness? Reassuringly, real narrow money growth rebounded in late 2014 – second chart. It is, however, still lower than a year ago and below the level in the Eurozone. The recovery, moreover, reflects a temporary oil-driven fall in inflation rather than faster nominal monetary expansion. 
Housebuilding activity is a longer leading indicator and is also giving a comforting message, with single-family starts and permits at new recovery highs in December – third chart.
A lower oil price is a net positive for the US economy but the impact is much smaller than in the past and in the Eurozone / Japan – fourth chart. Among the large economies, Korea and India are the biggest winners.
The US economy should perform respectably during the first half of 2015 but growth may fall short of bullish consensus hopes. Positive economic surprises are more likely in the Eurozone / Japan.
ECB reaction: QE expansion may prove poorly timed
The ECB is embarking on a large-scale sovereign QE programme against a backdrop of accelerating monetary growth, significant exchange rate weakness, fading fiscal restraint and a major terms of trade boost from the lower oil price. ECB policy was consistently too restrictive over 2008-12; it may now be making the opposite mistake.
The ECB will buy €60 billion of government and private-sector bonds per month from March 2015. Private-sector purchases have so far been running at €12 billion per month, so this implies government buying of about €50 billion, at least initially. The programme is “intended” to continue until September 2016 and “in any case” until inflation is judged to be returning to target; this phrasing allows for both an earlier or later end. 80% of the credit risk of the government bonds purchased will be carried by national central banks. The ECB simultaneously lowered the interest rate on future targeted longer-term refinancing operations (TLTROs) by 10 basis points.
A buying rate of €60 billion per month implies €720 billion per annum, or about 7% of Eurozone annual GDP. The table compares this with recent QE programmes in the US, Japan and the UK. The ECB’s buying rate is larger relative to GDP than the Fed’s during QE3 but much smaller than the Bank of Japan’s current pace.
The size of the programme, however, needs to be judged against existing monetary conditions. The ECB has already eased policy substantially, resulting in a strong acceleration in money growth. As the table shows, narrow and broad money are rising much faster than in Japan and the UK before their most recent major QE initiatives. Monetary trends are similar to those in the US when QE3 started.
The monetary pick-up suggests that economic prospects have already improved significantly. In addition, fiscal “austerity” is ending while the lower oil price is delivering a major boost to spending power. According to the IMF, the Eurozone “structural” budget deficit was cut by 2.5% of GDP between 2011 and 2013 but will decline by only 0.3% in 2014 and 2015 combined. If the current oil price is sustained, meanwhile, the Eurozone will enjoy a reduction in its import bill of about 1.25% of GDP in 2015.
The Eurozone economy, therefore, could rebound surprisingly strongly during 2015. Today’s ECB move may come to be seen as another case of policy-makers’ actions exaggerating the economic cycle rather than serving to dampen it.
| Country | Initiative | Date | Maximum buying | Maximum buying | M1 growth | Broad M* growth |
| Value per month | % of GDP | % 6m annualised | % 6m annualised | |||
| US | QE3 | Sep-12 | $85 billion | 6.3 | 11.5 | 4.7 |
| Japan | QQE | Apr-13 | ¥6.9 trillion | 17.1 | 4.6 | 2.9 |
| UK | QE3 | Jul-12 | £12.5 billion | 9.0 | -3.0 | 3.4 |
| Eurozone | QE1 | Jan-15 | €60 billion | 7.1 | 9.9 | 5.3 |
| *US M2 plus large time deposits & institutional money funds, Japan M3, UK M4ex, Eurozone M3 | ||||||
Is the ECB repeating the Fed's 1986 mistake?
A recent post noted that the oil price has fallen by more than 30% over six months on five previous occasions since World War Two. The global economy was stronger a year after these drops: the six-month increase in industrial output was higher than its starting level in all five cases.
Three of the five oil price falls (1991, 2001 and 2008) were associated with US / global recessions. A fourth (1998) reflected the Asian economic crisis. The 1986 decline bears the closest resemblance to today. It was partly the result of a mid-cycle global economic slowdown but the more important drivers were a large rise in non-OPEC supply and a structural reduction in demand due to energy conservation in response to a sustained high price in the early 1980s.
The first chart overlays the path of spot Brent in the mid 1980s on its recent movement, with the 1980s price rescaled by multiplying it by four. Based on the earlier episode, Brent could bottom at below $40 during the first quarter before recovering to $70-80 by end-2015.
The recovery could be stronger if non-OPEC supply is more price elastic than in the 1980s, as some analysts contend.
The oil price bottomed in July 1986. G7 industrial output growth embarked on a strong recovery soon after, reaching a boom level by late 1987 – second chart.
G7 consumer price inflation fell sharply in 1986 but retraced most of this decline in 1987 – third chart. 
Falling US inflation contributed to the Federal Reserve cutting its target Fed funds rate by 2.125 percentage points between December 1985 and August 1986. The Fed, however, reversed course in December 1986 and was forced to tighten aggressively in 1987 as the economy boomed. Longer-term Treasury yields bottomed in April 1986 ahead of the oil price, moving sideways over the remainder of the year before rising sharply from March 1987 – fourth chart.
The relevant comparison today may be with the Eurozone. ECB President Draghi is using a temporary fall in headline consumer prices to push through further easing despite monetary trends and leading indicators suggesting improving economic prospects, with Germany already at full employment. In 1986, the Fed started to raise rates only four months after its final cut. Mr Draghi is likely to fire the starting gun for sovereign QE tomorrow but his ECB opponents may have strong grounds for calling for a suspension later in 2015.
China still on moderate growth track, defying bears / bulls
The Chinese economy regained some momentum during the second half of 2014, but mixed leading indicator / monetary signals suggest that growth will remain moderate.
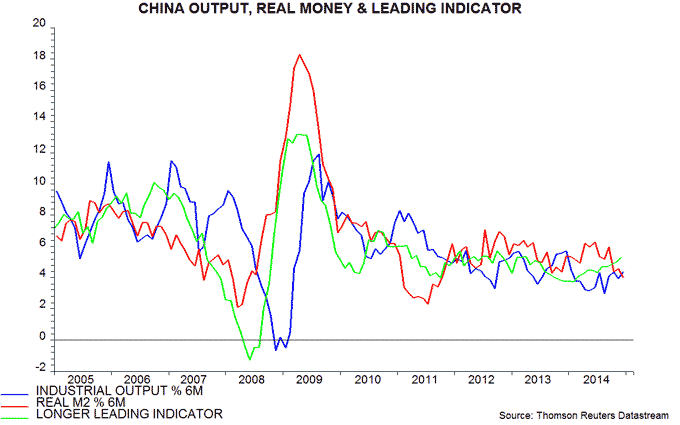
The six-month increase in industrial output peaked at 5.7% (not annualised) in December 2013, falling to a low of 3.0% in August 2014 before recovering to 4.4% in December*. Output rose by a strong 1.3% in December alone, partly reflecting catch-up after a below-par gain in November (when production was depressed by factory shutdowns to curb pollution in Beijing during an APEC meeting).
The economic slowdown and recovery were foreshadowed by falls followed by rises in real (i.e. inflation-adjusted) money supply M2 growth and a composite longer leading indicator – see first chart**. The leading indicator increased further in December but real money growth has fallen back since September. Monetary trends typically provide an earlier signal so this combination suggests that economic momentum will continue to strengthen in early 2015 before fading again towards mid-year.
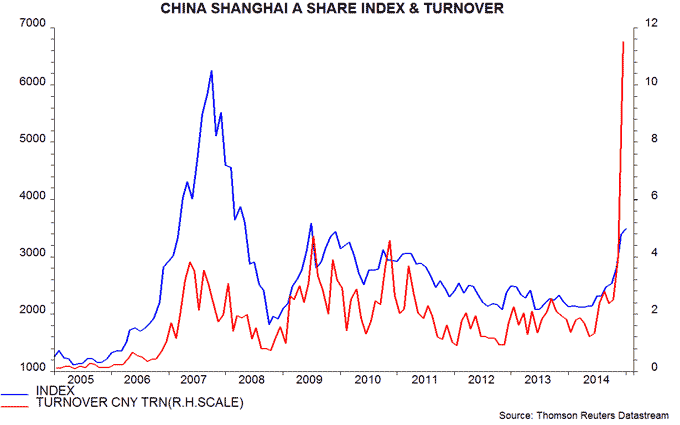
Slightly better economic news reduces the urgency of further policy easing. Near term at least, the authorities may prefer targeted measures to cuts in reserve ratios or official interest rates, which would risk reigniting excessive stock market speculation. Record turnover in the Shanghai A share market in December was 2.4 times the previous monthly high in July 2009 – second chart.
*These figures are based on a seasonally-adjusted level series compiled by the World Bank.
**The components of the leading indicator are the NBS purchasing managers’ index, steel production, cargo handled at major seaports, the industrial sales / output ratio, residential floorspace sold and bank loans.
