
Entries from February 1, 2019 - February 28, 2019
Euroland money update: economic prospects improving?
 Simon Ward
 1 Comment
Euroland January money numbers were reassuring, arguing against recession worries and suggesting that economic momentum will revive during 2019 – barring external shocks.
Six-month growth of real narrow money – as measured by non-financial M1 deflated by consumer prices – rose further in February, reaching a 15-month high. Real broad money (non-financial M3) expansion was stable at a two-and-a-half-year peak. The growth rates have risen since July 2018, suggesting an improvement in GDP momentum from around April, assuming a typical nine-month lead – see first chart.
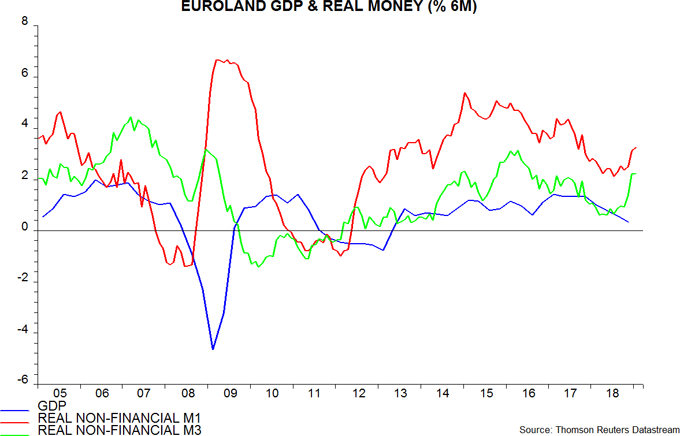
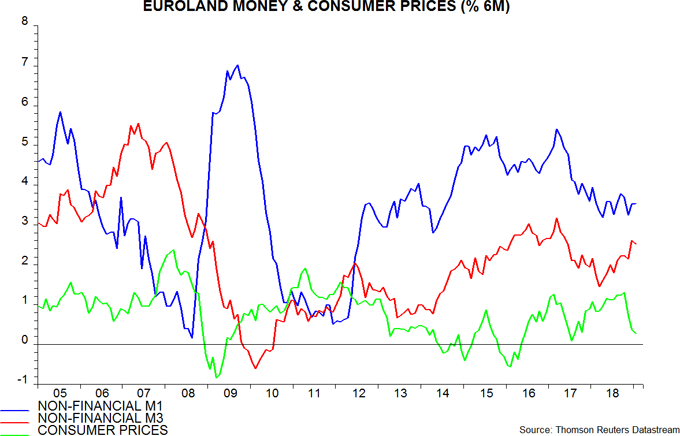
Real money trends, admittedly, have been boosted by a sharp fall in six-month inflation, which is likely to reverse into the second half. Nominal narrow money growth, however, has been stable at a respectable level since early 2018, while broad money expansion has picked up – second chart. The inflation boost to real money growth should be reflected in economic momentum later this year even if it proves temporary.
Sectoral numbers show that the rise in real narrow money growth has been driven by the household component, while corporate expansion remains weak – third chart (NFC = non-financial corporate). Economic resilience, therefore, is likely to depend on stronger consumer spending, which in turn requires companies to maintain employment levels despite recent weaker demand and downward pressure on profits.

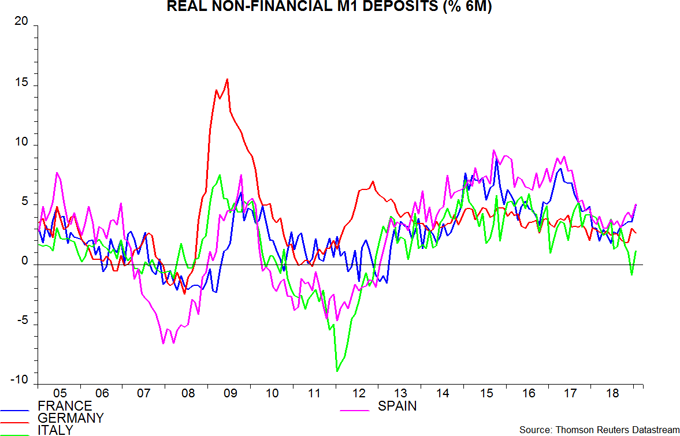
At the country level, Italian real narrow money momentum recovered in January but continues to lag significantly, while growth in France and Spain has strengthened, suggesting improving economic prospects – fourth chart.
Money trends / stocks cycle suggesting US weakness
Global industrial weakness, as expected, has intensified in early 2019. Based on last week’s flash results for the US, Japan and Euroland, the global PMI manufacturing new orders index is estimated to have fallen below 50 in February, reaching its lowest level since 2012 – see first chart. The final reading will depend importantly on Chinese results released on Friday.

As previously discussed, six-month growth of global real narrow money bottomed in October, implying a low in industrial output momentum around July 2019, allowing for a typical nine-month lead. PMI new orders usually move slightly ahead of hard output data, so could reach a trough some time in the second quarter.
Global real narrow money growth remains weak, arguing against a strong PMI rebound. Current money trends contrast markedly with mid 2012 and early 2016 when the prior two economic slowdowns were coming to an end.
Hopes of significantly stronger narrow money growth rest mainly on a pick-up in China in response to policy easing. Six-month expansion of our Chinese true M1 measure rose in January but New Year timing can distort the data at this time of year – February numbers will be key for assessing whether the trend has turned. Chinese money market rates have fallen further but pass-through to lending rates, particularly mortgages, is proving slow – second chart (the last data points are for December).

A turnaround in the global PMI could be driven by a moderation of Euroland weakness. Euroland new orders have undershot the global aggregate but real money growth has recovered since July 2018 and was stronger than elsewhere in December (January figures are released tomorrow) – third chart.

US and Chinese real narrow money trends were weak until December / January, suggesting that PMI new orders will decline further (US) or remain soft (China) through the first half.
Previous posts argued that a downswing in the global stockbuilding cycle would depress economic momentum in late 2018 and through most of 2019. Available national accounts data indicate a significant negative GDP impact in Euroland in the fourth quarter but the US cycle is lagging: wholesale inventories surged in late 2018, diverging from weak sales – fourth chart. US inventory adjustment could contribute to surprisingly weak GDP expansion during the first half.

Some commentators have cited a pick-up in US broad money growth in late 2018 / early 2019 as a reason for economic optimism. This acceleration partly reflects solid bank lending expansion, driven by commercial and industrial loans. C&I loan strength, however, is the counterpart of the build-up in stocks – see previous post – and is likely to reverse as these are adjusted, suggesting a slowdown in broad money.
Chinese data flattered by New Year timing effect
Chinese trade and money / credit releases for January reported recoveries in year-on-year comparisons and have been interpreted positively by market participants seeking evidence of economic turnaround. The suspicion here is that the improvements reflect a New Year timing effect and will reverse in February.
New Year fell on 5 February this year, 11 days earlier than in 2018. Exporters front-load shipments ahead of the holiday. When New Year is in early February (or late January), this bulge shows up in January exports. When the holiday occurs later, as in 2018, the February number benefits.
This effect is likely to explain the recovery in the year-on-year change in exports in US dollars from -4.4% in December to 9.1% in January. The February figure may fall sharply as high exports a year before drop out of the annual comparison – year-on-year export growth surged to 43.6% in February 2018.
This suggestion is supported by a comparison with two pairs of years with similar New Year timings - 2010 / 11 and 2007 / 08. The first chart superimposes year-on-year changes in exports in those years on recent data. In both cases, a rise in growth in January of the second year was more than reversed in February.

The earlier New Year may also have contributed to a rise in year-on-year narrow money growth – as measured by true M1 including household demand deposits – from 3.4% in December to 5.1% in January. Demand for transactions money increases ahead of the holiday, with the effect showing up in end-January monetary data when the New Year occurs in early February. Money growth, like export growth, fell between January and February in 2011 and 2008.
Money and credit trends may be starting to revive in response to policy easing but a significant recovery in economic data is unlikely before late 2019, judging from the lead time at previous turning points in 2008, 2011 and 2015 – second chart.

Global monetary update: temporary inflation relief
Global six-month real narrow money growth is estimated to have risen further in January, based on partial data. This increases the probability that October marked a low, in turn suggesting that economic momentum will reach a low around July 2019, allowing for a typical nine-month lead. The recovery to date, however, has been modest and driven by a slowdown in inflation, which may reverse into mid-year. A pessimistic economic view will be retained here pending a more convincing monetary rebound.
The US, China, Japan, India and Brazil have released January monetary data, together accounting for about two-thirds of the G7 plus E7 aggregate tracked here. All countries bar Japan and Canada, meanwhile, have released inflation data. Six-month real narrow money growth is estimated to have risen to a 14-month high – see first chart.

The level of growth remains weak by post-crisis standards – it was lower in only three months between September 2008 and November 2017. The recent recovery, moreover, reflects a sharp fall in six-month consumer price inflation, with nominal money growth moving sideways – second chart. Inflation is likely to rebound into mid-year if commodity prices stabilise at current levels – third chart. Nominal money trends need to pick up to warrant hopes of late 2019 economic improvement.


Are equities "looking through" current economic weakness?
Global (i.e. G7 plus E7) six-month industrial output growth is estimated to have fallen to a 29-month low in December – only Canada has yet to release data. Industrial output momentum, suitably scaled, correlates closely with GDP growth, suggesting weakness in forthcoming data for the latter – see first chart.

The central scenario here, based on narrow money trends, is that industrial output momentum will decline further to a low around July, with little immediate recovery. Suppose that this timing proves correct and – though not currently signalled – global growth rebounds significantly in late 2019. Would such a prospect warrant a belief that global equities bottomed in December and have embarked on a sustainable upswing?
To address this issue, we examined the behaviour of global stocks around previous troughs in economic momentum. There have been 13 lows in G7 plus E7 six-month industrial output momentum since 2000, associated with downswings of varying severity. These troughs, and the associated prior lows in six-month real narrow money momentum, are highlighted in the second chart.

The red squares in the third chart, showing the MSCI World index, mark the dates of these economic momentum troughs. Nine of the 13 instances were associated with in an equity market reversal from weakness to sustained strength. In the other four cases, stocks fell after the low in industrial output momentum – so an economic turnaround later in 2019 is no guarantee of a resumption of a bull trend in equities.

In the nine cases where equities reflected the economic shift from slowdown to recovery, the market low occurred, on average, 2.4 months before the trough in output momentum – these lows are highlighted by the green crosses on the chart. The maximum market lead was six months, with one instance of a one-month lag.
On the basis of this experience, a July 2019 trough in industrial output momentum might be expected to be foreshadowed by an equity market low in April or May. A December 2018 bottom, implying a seven-month lead, would be outside the historical range.
Relatively long leads – of five and four months respectively – occurred in 2010 and 2012. Equities may have rallied early because of expectations of additional QE, confirmed by subsequent Fed announcements. The Fed has recently taken further rate rises off the table but QT is likely to continue at least through mid-year. An easing move is implausible barring renewed market declines and / or shockingly weak economic news.
The assessment here is that current economic conditions resemble those in late 2000 / early 2001. Global industrial output momentum reached a major low in June 2001, rebounding strongly in 2002. Equities rallied briefly ahead of this trough before plunging again, with an eventual low reached in October 2002. The reversal lower was influenced by the 911 terrorist attacks but, in addition, valuations were still unusually high in mid-2001 – fourth chart. Current valuations are less extreme, arguing against a similar prolonged divergence of economic and market trends.

Negative US monetary revisions
The Fed yesterday released revised monetary data reflecting the annual benchmarking process and updated seasonal factors. Growth of narrow and broad money in 2018 was revised down significantly – see first and second charts.


The new data, in particular, show a smaller recovery and lower levels of six-month growth at end-2018.
The third chart shows the impact of the revision on global (i.e. G7 plus E7 ) six-month real narrow money growth*. The trough in the series still occurs in October 2018, suggesting a low in six-month industrial output momentum around July. On the previous data, however, growth had risen to a nine-month high in December. The new December reading is no higher than September's.

The new data, therefore, reinforce the negative assessment here of near-term US and global economic prospects while suggesting that weakness will extend into late 2019.
*M1A is used as the US component of this measure. The opportunity was also taken to revise the adjustment made to Indian M1 data to attempt to correct for the impact of demonetisation, with the distortion now assumed to have fully washed out by August 2018.
