Entries from February 1, 2013 - February 28, 2013
UK MPC-ometer still suggesting hold
The “MPC-ometer” model followed here, which predicted that several members would press for additional stimulus at the February MPC meeting, continues to suggest another majority vote for no change next week – see previous post for more information about the model.
This prediction incorporates February consumer survey results released yesterday, showing stable confidence but another rise in price expectations – see chart. The final reading will depend on manufacturing and services purchasing managers’ surveys released tomorrow and on Tuesday – these would need to deteriorate sharply to trigger an easing forecast.
It is possible that the MPC’s “reaction function” has shifted dovishly but – as the previous post explained – the February vote was consistent with the Committee’s historical response to the data. A decision next week to expand QE or cut the interest rate on a portion of bank reserves, in contradiction to the model forecast, would be important evidence of such a regime shift.
UK GDP revision: the onshore economy never "double dipped"
The quarterly change in GDP in the fourth quarter of 2012 was left unchanged at -0.3% but there were notable upward revisions to prior quarters, resulting in year-on-year growth of 0.3% versus an estimate of zero a month ago. Excluding oil and gas extraction, the economy expanded by 0.6% in the latest four quarters – much better than “flat-lining”.
The quarterly changes in non-oil GDP between the third quarter of 2011 and the third quarter of 2012 are now reported as follows: +0.6%, -0.2%, 0.0%, -0.3% and +1.0%. The 0.3% fall in the second quarter of last year was entirely due to an additional bank holiday so there was a genuine decline in only one quarter – the fourth quarter of 2011*.
The onshore economy, in other words, never “double dipped” in late 2011 / early 2012, in the conventionally-understood sense of recording successive quarterly contractions.
A further point is that the 0.1% fall in non-oil GDP in the fourth quarter of 2012 is attributable to an unwind of the Olympics boost. In the unlikely event of this year’s first quarter registering a decline, this will not qualify as another “dip” (second not third) – a second-quarter fall will also be required.
Will the triple-dippers please acknowledge their mistake, or else make clear that their phantom recessions reflect weak North Sea production, bank holidays and the impossibility of hosting the Olympics every quarter?
*This contraction was caused by a squeeze on real incomes and spending from consumer price inflation spiking to 5.2% in September 2011.
Eurozone money trends consistent with slow growth but French weakness intensifying
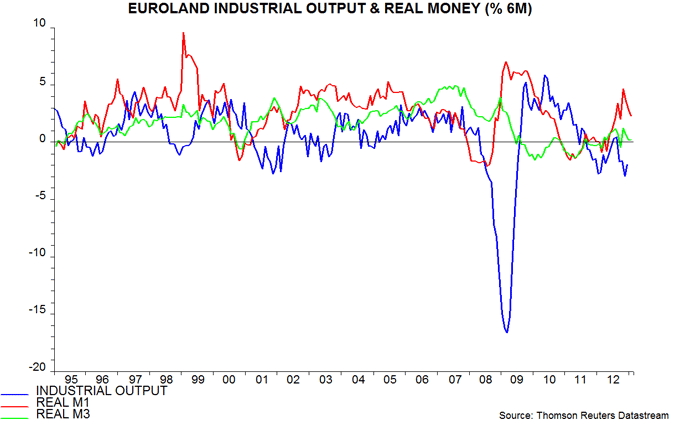
Eurozone monetary trends remain consistent with economic improvement but real M1 expansion has fallen back, suggesting that growth will be insufficient to prevent a further rise in unemployment. French M1 contraction, moreover, has accelerated – a deepening recession in that country could be the next focus of regional strains.
Six-month growth in eurozone real M1 was 2.3% (not annualised) in January, down from an October peak of 4.7% but still consistent with moderate economic expansion – see first chart. Real M3 growth was weaker at 0.2% but is less useful for forecasting the economy. Both measures were contracting a year ago, correctly signalling a recession.
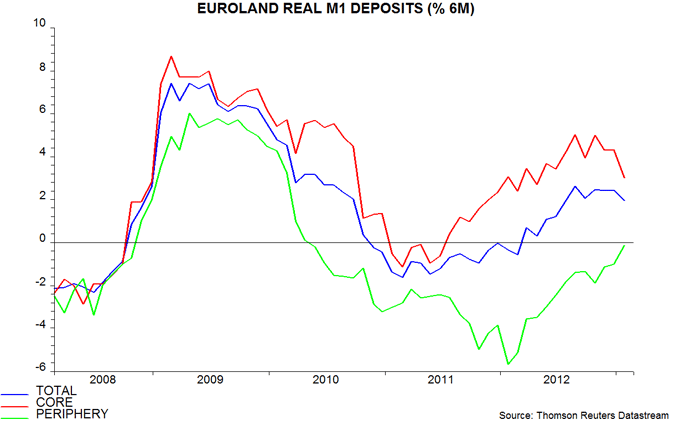
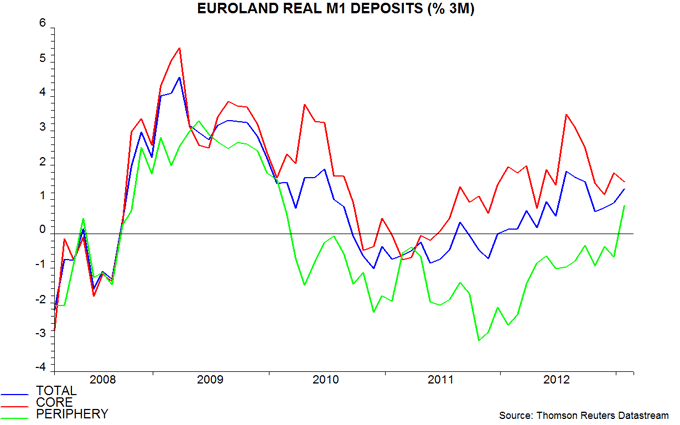
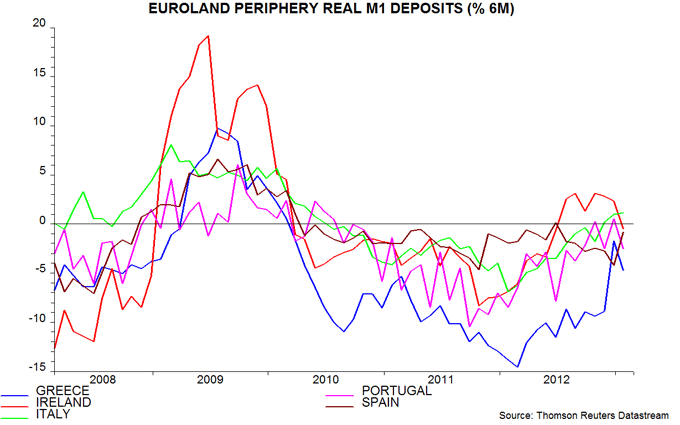
Encouragingly, M1 divergence between the core and periphery continues to narrow. The six-month fall in combined real M1 deposits in Greece, Ireland, Italy, Portugal and Spain slowed to 0.1% in January, the smallest since April 2010 – second chart. In the last three months, peripheral real deposits rose by 0.8% versus a 1.5% increase in the core – third chart.
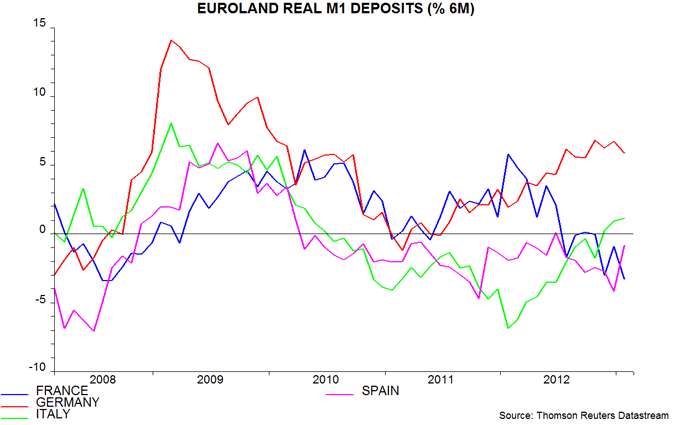
In the big four economies, real M1 deposits grew strongly in Germany and modestly in Italy in the six months to January – fourth chart. Spanish contraction slowed last month and the main focus of concern is now France – the six-month fall accelerated to 3.3% versus a maximum decline of 3.4% before the 2008-09 slump. Other notable recent developments include a sharp slowdown in Belgium and the Netherlands and renewed Irish weakness.
Central bank liquidity bottoming as ECB drag fades
A post three weeks ago suggested that a decline in G3 central bank liquidity would constrain near-term market prospects. Bank reserves at the Fed, ECB and BoJ combined had fallen to an 11-month low as a repayment of borrowing from the ECB by Eurozone banks offset US and Japanese QE operations. With banks able to repay the second ECB three-year LTRO from end-February, G3 reserves were projected to remain below their February 2012 peak until May.
The chart is an update from the previous post, showing actual reserves and projections based on announced US and Japanese QE plans and an allowance for the impact of the second LTRO repayment. As expected, the G3 total has tracked sideways since early February. The Eurozone and aggregate projections, however, have been revised up to reflect last week’s news that banks will make a smaller-than-expected initial repayment of €61 billion of the second three-year LTRO – much lower than the €137 billion initial pay-back of the first such loan.
After a fall this week as this repayment settles, G3 reserves are forecast to resume an upward trend, exceeding their previous peak in late April – slightly earlier than previously projected.
As the chart shows, US reserves are tracking the expected path but Japanese reserves continue to undershoot. The earlier post speculated that the BoJ was temporarily sterilising the liquidity impact of QE in order to slow the decline in the yen. With this objective achieved, Japanese reserves may reconnect with the projection. The forecast path, moreover, is likely to steepen as a dovish new BoJ leadership pushes through additional easing.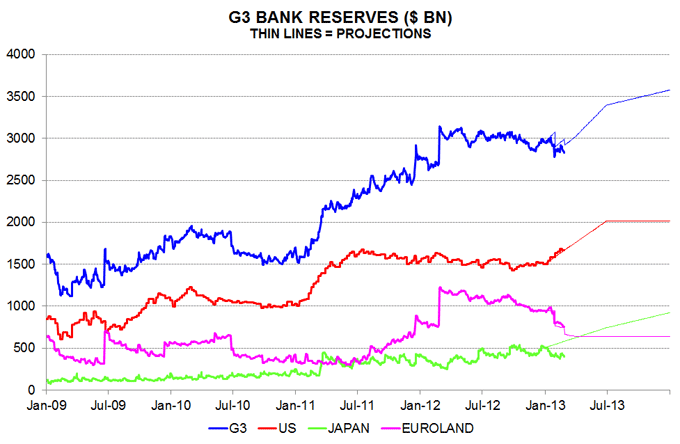
Global "excess" money still supporting markets
Previous posts, e.g. here, have discussed a simple investment strategy involving buying global equities six months after G7 annual real narrow money growth crosses above industrial output expansion and moving into cash immediately on a reversal. This strategy has outperformed buying-and-holding equities by 3.6% per annum since 1970 – see chart. World stocks have beaten cash by 31% since the last “buy” signal in September 2011.
The monetarist “theory” underlying the strategy is that deviations between the supply of money and the demand to hold it are a key driver of asset price changes. If the (unobservable) demand to hold money is assumed to grow in line with the product of industrial output and prices – a reasonable working hypothesis – then the gap between real money and output growth will measure “excess” or “deficient” liquidity.
The historical success of the investment strategy reflects a strong tendency for bear markets to occur during periods of deficient liquidity, i.e. when G7 real money growth falls short of industrial output expansion. This shortfall, in effect, causes firms and households to attempt to raise cash in asset markets, with the resulting imbalance of supply and demand putting downward pressure on prices.
The strategy applies a six-month lag on entry to reflect a tendency for increased liquidity to flow initially into bonds. Indeed, liquidity improvement often begins when the economy is weak and equities still under downward pressure.
The strategy remains invested in equities currently, reflecting a still-wide divergence between the annual rates of change of G7 real money and industrial output – 7.7% and -0.8% respectively in December. The gap, however, may close during the first half of 2013 as industrial activity revives and an energy-led rebound in inflation slows real money expansion.
The rising weight of emerging economies suggests that the rule should now be applied to G7 plus E7 data. G7 plus E7 real narrow money grew by an annual 6.1% in December versus a 0.9% gain in industrial output. The gap, in other words, is smaller than for the G7 but still significantly positive.
Current excess liquidity does not preclude a near-term drawdown nor guarantee that the next “sell” signal will occur at a higher level of prices than today. It does, however, cast doubt on claims that another equity bear market is imminent.
Will emerging market equities outperform?
The February Merrill Lynch global fund manager survey reports that a net 43% of respondents are overweight emerging market equities, the highest proportion for 12 months. The degree of enthusiasm is surprising because emerging equities have failed to deliver in recent years: the ratio of MSCI emerging and developed market indices is currently 17% below a peak reached in September 2010* – see first chart.
Less favourable liquidity conditions have contributed to this underperformance. The price relative peaked as the gap between E7 and G7 real six-month narrow money expansion narrowed sharply, turning negative in early 2011 – second chart. The glory days of emerging equities in 2009-10 and before the financial crisis, by contrast, occurred against the backdrop of relative monetary buoyancy.
The real money growth gap remains negative but has narrowed recently, raising the possibility of a “buy signal” for emerging equities later in 2013. A better January E7 number, however, is mainly due to China, where the late timing of the New Year holiday may have imparted a temporary boost – see previous post. Monetary trends remain soft in other large emerging economies – third chart.
With overseas investors already overweight, better relative performance of emerging equities may depend on a pick-up in domestic buying, in turn suggesting awaiting more convincing evidence of an improving monetary backdrop before adding to exposure.
*Based on month-end data and yesterday’s close.


