
Entries from December 1, 2020 - December 31, 2020
Global monetary backdrop less market-friendly at end-2020
 Post a Comment
The monetary backdrop for markets has become less favourable, suggesting increased volatility and greater downside risk for equities and other risk assets.
A simple “monetarist” rule for switching between global equities and US dollar cash is monitored here, based on two measures of “excess” money – the gap between six-month growth rates of real narrow money and industrial output, and the deviation of 12-month real money growth from a long-run moving average. Historically, equities outperformed cash significantly on average when the measures were positive, and underperformed when they were negative – see first chart.

The simple rule holds equities only when both measures are positive, otherwise reverting to cash. Despite being “out of the market” for long periods, the rule would have outperformed buying and holding equities by a wide margin – second chart.

The rule allows for data publication lags and recommended cash at the start of 2020 – real narrow money growth was above (weak) industrial output growth but remained below its long-run average. The latter shortfall reversed in March, causing the rule to switch to equities at end-April.
A V-shaped industrial recovery, however, was reflected in six-month output growth surging past real money growth in October, with partial data indicating that the lead was maintained in November – third chart. The first of the two measures, therefore, turned negative In October, resulting in the simple rule recommending a switch to cash at end-December.

The period in cash could be quite short. On plausible projections, included in the above chart, the six-month real money / industrial output growth gap could turn positive again in January, in which case the rule would switch back to equities at end-March.
A further caveat is that equities performed worst historically when both measures were negative. Underperformance relative to cash was modest on average when the first measure was negative but the second positive, as now.
What's up with US M1?
US narrow money M1 has surged since the elections. The stock of M1 jumped by 14.1% between the weeks ending 16 November and 30 November, a larger two-week rise than occurred in March / April in response to Fed easing – see chart.
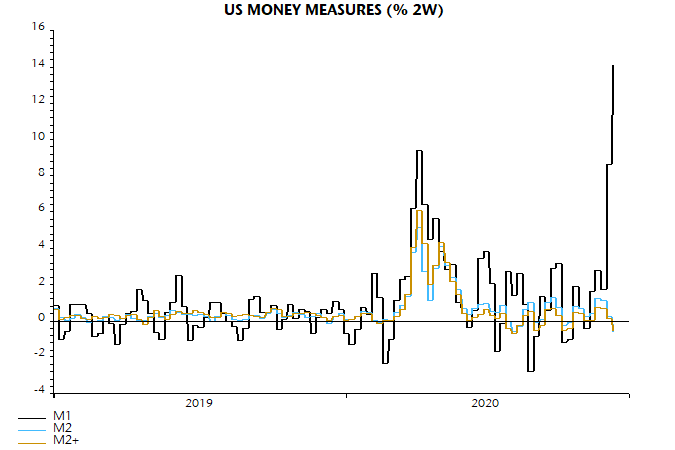
Broader money measures, however, have been unmoved – in contrast to the spring, when they also surged. M2 fell by 0.6% between the same two weeks, as did a broader aggregate including large time deposits and institutional money funds (“M2+”).
What’s going on? Data on money stock components show a large increase in demand deposits – included in all the money measures – offset by a fall in savings deposits, which feature only in the broader aggregates.
One possible explanation is that households and firms are mobilising precautionary balances accumulated as a hedge against a chaotic election outcome. Money could be shifting from inactive, “low velocity” savings accounts to “high velocity” demand deposits, prior to its deployment in the economy and markets. This would be extremely bullish for activity and equities.
An alternative technical explanation, however, is more likely. The Fed in April removed a six-per-month limit on transfers from savings accounts. This change has implications for the way banks report their deposits on the FR2900 form that feeds into the monetary data. Banks were asked to continue to report such accounts as savings deposits if they retained the right to request advanced written notice of withdrawal. Where this right was removed in addition to the six-per-month limit, however, the Fed advice was to report the account as a transactions deposit, i.e. as a demand deposit or under the “other checkable” category (depending on further conditions). “Other checkable” deposits, which are included in M1, also rose sharply in the latest two weeks.
The H.6 money stock release contains no warning of any distortion to the M1 data but it is likely that one or more large commercial banks reclassified a bloc or blocs of savings accounts as transactions deposits in the latest fortnight, causing them to move into M1 from the non-M1 portion of M2.
This explanation is supported by the observation that savings deposits at thrift institutions – accounting for only 11% of total savings deposits – rose in the latest two weeks, in contrast to the huge fall in such deposits at commercial banks.
Assuming that this explanation is correct, it is unclear why there has been a seven month interval between the April rule change and the reclassification, or why several banks may have made the change simultaneously.
A message has been submitted to the Fed’s statistical department requesting clarification of the above points and any response will be reported here. In the meantime, the M1 surge should probably be discounted.
 Simon Ward
A response has yet to be received but the Fed has implicitly acknowledged an upward distortion to M1 from reclassification of savings accounts by announcing a major overhaul of its monetary statistics in the latest H.6 release. From February 2021, M1 will be redefined to include all savings deposits, with existing data revised back to May 2020 (the first full month after the April removal of the six-per-month limit on withdrawals from savings accounts). M1 rose by 1.7% month on month in November on the new definition versus 8.4% on the old. The new M1 will encompass 93% of an unchanged M2 (which additionally includes small time deposits and retail money funds). The M1 redefinition has a statistical rationale but not an economic one – the monetary characteristics of savings accounts remain distinct from demand deposits despite the removal of the withdrawal limit. The measure of narrow money used in the analysis here will continue to exclude savings accounts.
Market correction or monetary reacceleration?
Why markets could weaken
1. Global six-month real narrow money growth fell below industrial output growth in October. Equities have underperformed cash on average when this has been the case historically (allowing for a two-month reporting lag, i.e. the signal is negative from December).
2. Global manufacturing PMI new orders are probably closing on a short-term peak. Six-month real narrow money growth peaked in July and has led peaks in PMI new orders by seven months on average historically – see chart. PMI peaks are often associated with market weakness.
3. Headline CPI inflation rates will rise sharply into Q2 2021, reflecting energy price movements and a likely increase in core momentum as policy effects reverse and firms pass on higher costs (global PMI manufacturing and services output price indices are above average).
4. The Chinese economy could disappoint current bullish expectations in H1 2021: market rates have risen significantly and money / credit growth is moderate and slowing.
5. The pattern of market returns since the Q2 2020 stockbuilding cycle low has been consistent with prior cycle recoveries but some of the moves look extended.

Why any significant correction could represent a buying opportunity (conditional on confirmation from monetary and other signals)
1. The negative real narrow money / industrial output growth gap reflects a temporary spike in the in the latter – a reversal is possible as early as January (implying a positive market signal for March, allowing for the two-month lag).
2. Real narrow money growth remains above average and the three investment cycles – stockbuilding, business capex and housing – are all now in upswings, so any PMI weakness is likely to be modest and short-lived.
3. Bear markets usually start after the stockbuilding cycle peaks – unlikely before late 2021 at the earliest.
4. The Chinese authorities will probably act to cap rates and stabilise money / credit growth at an expansionary level.
5. The global broad money stock remains well above the level consistent with current levels of nominal GDP and asset prices, implying medium-term upward pressure on some combination of activity, goods and services prices and markets.
What could derail the correction scenario
The correction possibility derives from the moderation in global real money growth after its March-July surge. An immediate new pick-up in money growth would give markets an additional boost and could neutralise the above-mentioned short-term negative factors. Commodity price strength would probably extend significantly further in this scenario, implying a larger rise in inflation. Associated upward pressure on bond yields could lead to more serious and sustained weakness in equities later in 2021. November / December monetary data will be important for assessing the validity of this alternative scenario.
"V" recovery in global profits
Former Bank of England deputy governor Sir Paul Tucker recently described talk of a V-shaped recovery as “beyond stupid”. Sir Paul may be unaware that global retail sales and industrial output surpassed their pre-covid peaks in June and September respectively. (Sir Paul has displayed a detachment from reality in the past, for example in his design of the Bank of England operating system that failed spectacularly during the GFC because of its lack of a discount window through which banks could access emergency liquidity.)
The rolling V recovery, at any rate, has now extended to global profits. A national accounts based measure of G7 gross domestic operating profits (equivalent to EBITD) rebounded strongly in Q3, regaining its Q4 2019 level – see first chart. The numbers cover all sectors (i.e. including virus-restricted services) and unlisted as well as listed companies. Chinese industrial profits, meanwhile, were up by 28% in the year to October.

The profits rebound provides further confirmation that the G7 / global business investment cycle bottomed in Q2 2020, implying that all three investment cycles (inventory, business, housing) are now acting to lift to underlying economic momentum – second chart. The forward-looking business capex survey indicator monitored here stepped back in November because of the European lockdowns but the signal remains positive – third chart.


G7 Q3 profits strength was focused on the US, where domestic non-financial corporate profits (net of interest and true economic depreciation) surpassed a Q4 2018 high – more evidence, on top of monetary trends, of superior US economic prospects. The UK numbers were also strong but should be discounted – the statisticians included a large “alignment adjustment” to fill a hole in the GDP accounts. Japanese profits lagged, reflecting a later economic recovery – a catch-up is likely.

Equity market analysts have been scrambling to adjust their forward earnings estimates to reflect profits reality. The MSCI ACWI earnings revisions ratio (number of upgrades minus downgrades as proportion of all estimates) reached a 10-year high in November, echoing the positive message from another strong global manufacturing PMI report – fifth chart.

The PMI report also confirmed that a V-shaped industrial recovery is filtering through to prices, with output and input price indices moving above their long-term averages. Supply-chain bottlenecks, reflected in many firms reporting lengthening delivery delays, are adding to upward pressure – sixth chart.

The question of whether an emerging inflation pick-up represents a temporary blip or a lasting move higher hinges on the extent to which monetary trends normalise over coming quarters. G7 three-month broad money growth eased further to 4.6% at an annualised rate in October but year-on-year growth of 16.1% remains higher than in any previous year since 1973. The view here is that three-month growth needs to slow further and remain weak for a sustained period to warrant confidence that inflation will return to its 2010s average after an expected 2021-22 bulge.

