
Entries from December 1, 2019 - December 31, 2019
Chinese credit conditions still tight
 Simon Ward
 Post a Comment
A recent pick-up in Chinese PMIs has boosted recovery hopes but the view here, based on monetary trends, is that such optimism is premature. December results of the Cheung Kong Graduate School of Business (CKGSB) survey support this scepticism.
The CKGSB corporate sales index correlates with official and Markit manufacturing PMIs and fell back in December after a modest three-month rise – see first chart.

Monetary trends were recovering in early 2019 but went into reverse post-spring as secondary banking problems caused a tightening of credit conditions. This tightening was reflected in a sharp fall in the CKGSB corporate financing index – which measures the ease of obtaining external funds – from an April peak. The index slid further to an 11-month low in December – second chart.

The Chinese PMI pick-up has contributed to a recent revival in optimism about global economic prospects, with commentators noting that Chinese manufacturing PMIs have tended to lead the global Markit measure in recent years – third chart. The common driver, however, may be Chinese real money trends, with very different implications – fourth chart.


Is market optimism premature?
The long-standing view here has been that global economic momentum would bottom around Q3 2019 but remain weak into H1 2020. December flash PMIs support the scenario: manufacturing PMIs, in particular, were disappointing, falling in all six countries for which flash data are released, although readings remained above recent lows in all but the UK and Australia.
Global narrow money trends, meanwhile, continue to cast doubt on hopes of a solid, synchronised economic recovery in 2020. Six-month growth of G7 plus E7 real narrow money is estimated to have edged up to 2.4% in November but remains below a post-GFC average of 3.2% (i.e. calculated over 2010-18). Real money growth rose above 4% ahead of economic pick-ups in 2012-13 and 2016-17 – see first chart.

Subdued G7 plus E7 real narrow money growth conceals a strong pick-up in the US since August offset by a deepening contraction in China – second chart. The latter development reflects a slowdown in nominal money growth coupled with a food-driven inflation surge and suggests that economic news will surprise negatively in early 2020 – see previous post.

The acceleration in monthly US narrow money numbers has been confirmed by the quarterly non-financial M1 measure, which performs slightly better as a leading indicator but is less timely – end-September data became available last week with publication of the Fed’s Q3 financial accounts. Allowing for a typical nine-month lead, the suggestion is that the US economy will regain momentum around mid-2020 after a weak start to the year.

The US pick-up has been driven by business money holdings, consistent with the expectation here that both the stockbuilding and business investment cycles will have entered recovery phases by mid-2020.

The suggestion from the monetary data of US relative economic strength later in 2020 raises the possibility of the Fed shifting back to a tightening bias in H2 before recoveries have been established in China and Europe – a potentially negative scenario for markets.
The MSCI All-Country World Index recently surpassed its January 2018 high in US dollar terms but is still down by about 4% relative to 10-year US Treasuries, indicating that markets are not yet fully convinced about an economic recovery – fifth chart.

Bullish commentators draw a parallel with 2011-12 and 2014-16, arguing that the relative return ratio will break out soon as recovery hopes are confirmed. As noted earlier, however, narrow money trends are significantly weaker now – the ratio could test the downside again first.
Bulls also cite recent record outflows from US equity mutual funds and ETFs, arguing that retail investors will be forced to chase the current rally – sixth chart. The Fed’s financial accounts, however, show that the equity share of US household wealth is high by historical standards, questioning the necessity of buying – seventh chart.


Chinese money trends suggesting PMI relapse
Hopes of a rebound in Chinese industrial output growth have been boosted by a pick-up in the Markit manufacturing PMI to the top of its range in recent years. Weak money trends suggest that these hopes are premature and the PMI will fall back.
November money and credit numbers released today were disappointing. Six-month growth of true M1 is estimated to have slipped further below its June peak, with broad money and total social financing also losing momentum – see first chart.
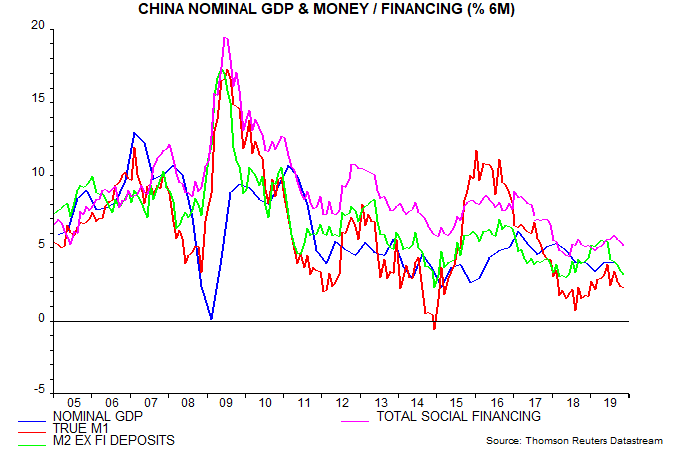
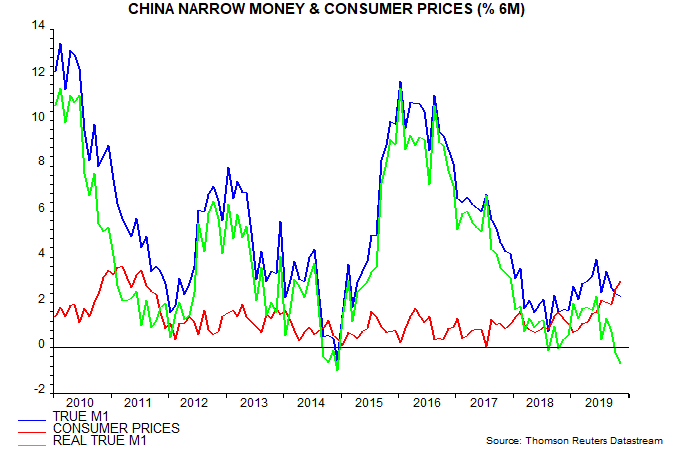
The weakness is more pronounced in real terms, i.e. relative to the consumer price index, which has been boosted by surging pork prices. The six-month change in real true M1 moved deeper into negative territory last month – second chart.
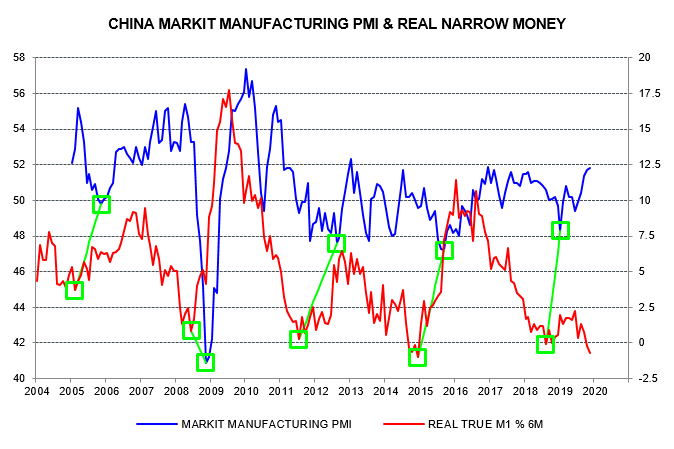
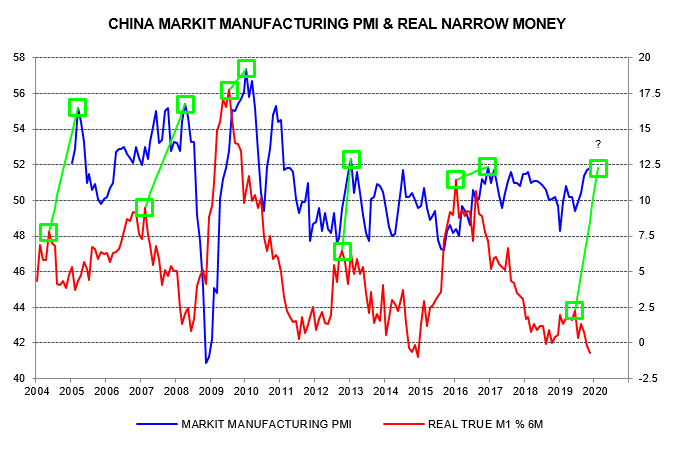
The third and fourth charts show that turning points in six-month real M1 momentum have signalled turning points in the Markit manufacturing PMI since the latter’s inception, with an average lead time of 8 months at the highlighted troughs and peaks. The rise in the PMI to a 35-month high in November was foreshadowed by a pick-up in real money growth between October 2018 and June. The subsequent monetary slowdown suggests that the PMI will weaken during H1 2020.
The inflation drag on real money is probably peaking and could reverse sharply in early 2020. Credit creation, meanwhile, will probably pick up, partly reflecting another surge in issuance of local government special bonds, although private firms may continue to struggle to obtain bank loans. These developments could lay the monetary foundation for a more durable recovery in economic momentum in H2 2020.
UK economy still stagnant / recessionary
UK monthly GDP / gross value added (GVA) for October will be released on 10 December, two days before the election. GDP is currently estimated to have fallen by 0.16% in August and 0.07% in September, with the September level 0.10% below the Q3 average.
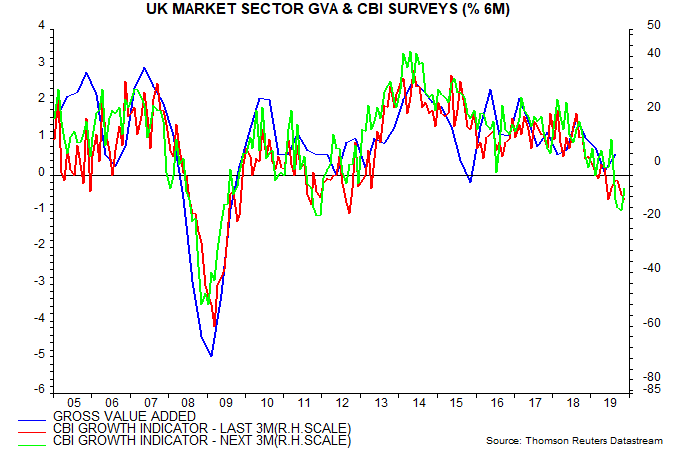
October / November PMIs are consistent with economic contraction. So are the CBI’s past and future growth indicators, based on their monthly surveys of industry, distributive trades and services – see first chart.
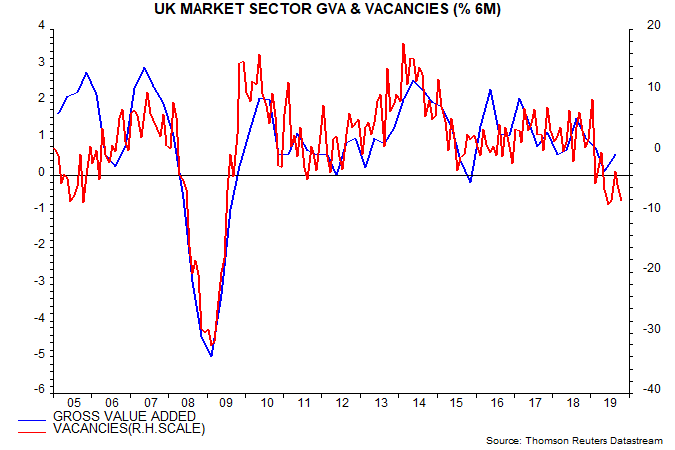
Vacancies are a coincident indicator of GDP and have fallen this year at the fastest pace since the 2008-09 recession, also suggesting contracting output – second chart.
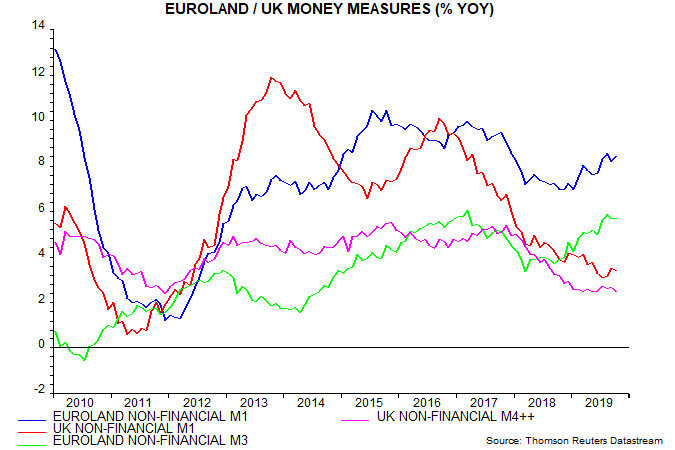
Monetary trends, meanwhile, remain weak. Annual growth rates of narrow and broad money have stabilised but are falling further below rising rates in Euroland – third chart. The UK economy has lagged in 2019 – GDP is currently estimated to have risen by 0.65% between Q4 2018 and Q3 2019 versus a Euroland increase of 0.86% – and relative money trends suggest a widening performance gap.
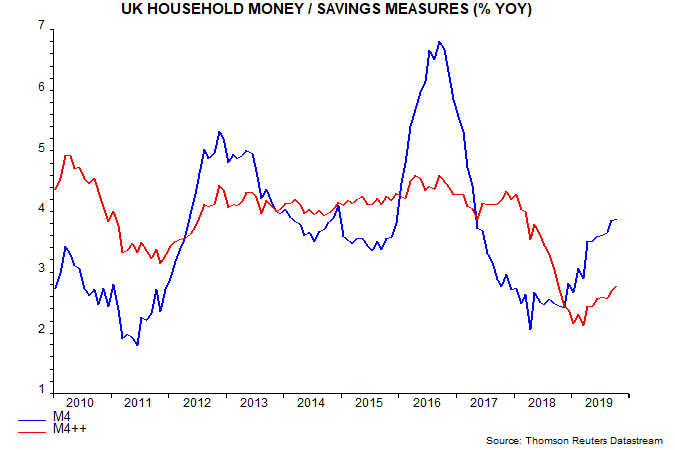
Within aggregate broad money, growth of household M4 holdings has recovered, leading some to suggest that consumer spending prospects are improving. This acceleration, however, mainly reflects a diversion of household savings from mutual funds to bank / building society accounts, which may signal rising risk aversion. Retail mutual fund inflows totalled £1.5 billion in the 12 months to September, down from £27.0 billion in the previous 12 months. Growth of an expanded measure of household money / savings incorporating mutual funds and National Savings (“M4++”) has risen by less and remains historically weak – fourth chart.
Global recovery not yet assured
Incoming news appears consistent with the assessment here that global industrial momentum bottomed in Q3 but will remain weak through Q1, at least.
The global manufacturing PMI new orders index recovered further in November but the current reading of 50.4 compares with a long-run average of 52.6 and suggests anaemic growth of industrial output – see first chart.

The PMI increase, moreover, was not mirrored by an alternative G7 plus E7 indicator that combines forward-looking components of national business surveys (ISM for the US, NBS for China, Ifo for Germany etc). This indicator bottomed in September but moved sideways below 50 in November – first chart.
Near-complete October monetary data, meanwhile, confirm that six-month growth of G7 plus E7 real narrow money slipped back to 2.3% from a downward revised 2.6% in September. This is above the range between December 2017 and August 2019, suggesting stronger economic momentum in mid 2020, but a rise through 3% is judged here to be necessary to confirm a “full” recovery later next year.
G7-only six-month real narrow money growth is above 3% (3.2%) but E7 growth remains well below (1.1%), mainly reflecting Chinese weakness – second chart.

As previously discussed, Chinese money trends lost momentum from Q2 as regional banking woes led to a tightening of credit conditions. Private firms still appear to be having difficulty accessing external finance: the corporate financing index component of the Cheung Kong Graduate School of Business survey weakened slightly further in November – third chart.

The global stockbuilding cycle probably bottomed in Q3 but a recovery may be delayed until H1 2020. While inventories have been slashed in some economies, notably Germany, the US is lagging (with the Q3 rise in inventories revised up last week) – fourth chart.

Recent weakness in US commercial and industrial lending, however, hints at a large stockbuilding drag on Q4 GDP – fifth chart.

The completion of German inventory adjustment could result in a rapid reconvergence of the country’s depressed manufacturing PMI with regional / global averages, a possibility also supported by the alternative Ifo survey – sixth chart.

