Entries from December 1, 2015 - December 31, 2015
Chinese money numbers: further improvement
Chinese money / credit statistics for November provide further evidence that policy easing is working, suggesting better economic news in early 2016.
Annual growth of the broader M2 money measure rose from 13.5% in October to 13.7% in November, the fastest since June 2014 – see chart. The solid level of growth, admittedly, partly reflects a rapid increase in financial deposits that may have limited implication for economic prospects. However, the annual increase in M2 excluding such deposits has also recovered significantly since early 2015.
Narrow money trends are more striking, with annual M1 growth surging to 15.7% in November, the fastest since December 2010. The preferred narrow aggregate here is “true M1”, which adds household demand deposits to the official M1 measure (comprising currency in circulation and corporate demand deposits). A November reading for true M1 is not yet available but annual growth was similar to that of the official measure in October and is likely to have risen further last month.
A claim has been made that the M1 surge is attributable to a temporary rise in demand deposits of local government financing vehicles. While this may have been a contributory factor, demand deposits of non-financial enterprises and households have accelerated strongly recently, suggesting that most of the pick-up is a genuine response to policy easing – see previous post.
Annual growth of the stock of “aggregate financing to the real economy” (i.e. bank loans and other forms of domestic fund-raising by households, non-financial enterprises and government organisations) eased to an estimated 12.2% in November from 12.5% at the end of the third quarter*. Financing growth, however, has been broadly stable over the past six months, having fallen significantly over 2013-14. The “credit impulse”, in other words, is no longer negative.
Within aggregate financing, annual growth of RMB bank loans was an estimated 13.9% in November and has also moved sideways in recent months. Rising money growth with stabilising credit expansion is usually a signal of improving economic prospects.
In other Chinese news, the annual rate of change in motor vehicle production rose to 17.7% in November, the fastest since December 2013, following the cut in the sales tax on smaller-engined cars in October. Vehicle production is a component of the OECD’s Chinese leading indicator.
*Official numbers available only for end-quarters; other months estimated from flow data.

OECD's Chinese leading indicator signalling growth recovery
As previously discussed, Chinese monetary trends suggest that economic growth has bottomed and will pick up significantly from end-2015. The OECD’s Chinese leading indicator supports this scenario.
The OECD presents its country leading indicators in “ratio to trend” form, i.e. a stable value indicates that an economy will grow at its trend pace. Its latest release refers to “tentative signs of stabilisation” in China. This somewhat underplays the positive signal because 1) Chinese trend growth is high so a return to this rate of expansion would represent a significant strengthening and 2) the ratio to trend indicator actually rose, rather than remained stable, in October, the latest month.
While the OECD prefers the ratio to trend presentation, it also calculates a leading indicator of the level of Chinese industrial output. The chart compares six-month and rescaled one-month changes in this indicator with the six-month change in output. The six-month indicator change has been firming gently since early 2015, while the one-month rise in October was the largest for two years.
The leading indicator comprises six components: production of chemical fertilizer, crude steel, buildings and motor vehicles, overseas orders from the PBoC’s quarterly survey of industrial enterprises and Shanghai stock exchange turnover value. The recent pick-up appears mainly to reflect stronger steel and vehicle production, along with a recovery in stock market turnover. Since the components are non-monetary, the positive signal is independent of better money / credit trends.
The stabilisation / recovery in the ratio to trend indicator suggests that annual industrial output growth will rise to about 8%, the OECD’s current estimate of trend. This compares with 5.6% in October, with a November number due shortly. One caveat: the OECD revises its leading indicators monthly, so another month or two of data are needed to confirm a change of direction.
ECB reaction: Draghi overpromised
The ECB badly mishandled its communications strategy in the run-up to today’s meeting, with comments from President Draghi and leaks about 20 different easing measures being under consideration encouraging market expectations of much more aggressive action than the announced 10 basis point cut in the deposit rate and six-month extension of QE at an unchanged pace. The suspicion is that Mr Draghi overplayed his hand and ran into stiff German-led opposition based on doubts about the economic case for further easing and objections to an income transfer from core to peripheral banks implied by a larger cut in the deposit rate. With headline inflation set to rebound, surveys signalling solid GDP growth and M3 expansion above the ECB’s “reference value”, markets may conclude that the window for further action has closed, putting a floor under the euro, especially with Fed Chair Yellen remaining resolutely non-committal about a second US rate rise.
Global economic update: when will Chinese news improve?
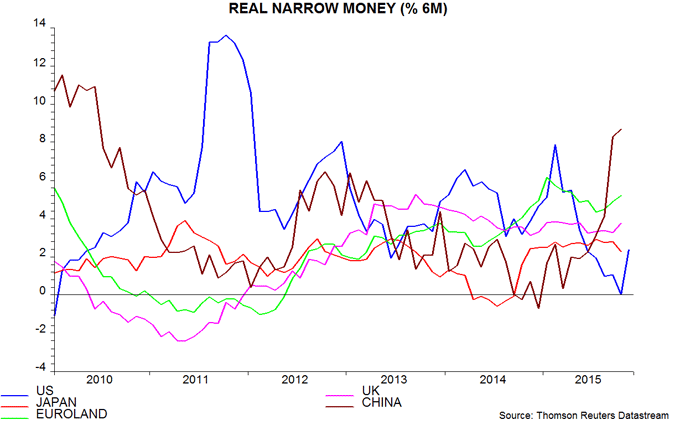
Global real narrow money* has been growing solidly in recent months, with strength in the Eurozone and China offsetting weakness in the US. Reflecting these trends, previous posts have suggested that:
1) Global economic growth would recover in late 2015 / early 2016.
2) The recovery would be driven by Europe / Asia, with US growth moderate at best.
3) This rotation would be welcomed by equity market investors, with stronger non-US growth supporting earnings expectations and a sluggish US tempering worries about the pace of Fed tightening.
Is this scenario panning out?
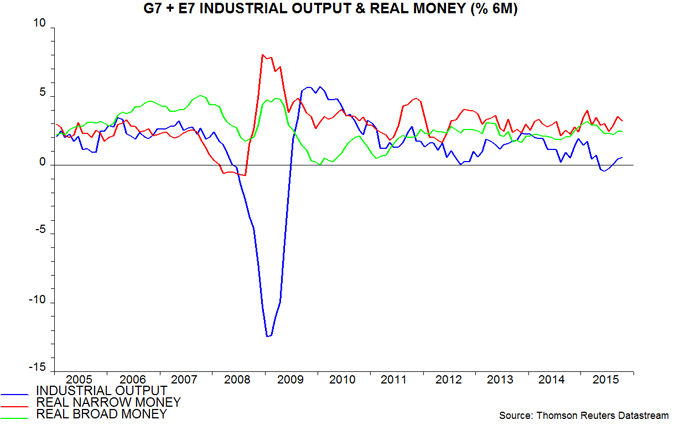
On 1), available data suggest that the six-month rate of change of global industrial output recovered further in October – see first chart. As noted on Monday, Korean companies are usually sensitive to changes in the global environment and have become significantly more optimistic, according to the latest Federation of Korean Industries survey. The Markit / J P Morgan global manufacturing purchasing managers’ index (PMI), however, was little changed in November.
On 2), the November manufacturing PMIs for Japan and the Eurozone were upbeat, while US results surprised negatively. The Chinese official and Markit / Caixin surveys, however, remained weak.
On 3), investors are sceptical that non-US growth can take up the baton if the US slows. Weaker US news, therefore, is producing a mixed market reaction, with earnings concerns offsetting the implied reduction in Fed tightening risk.
To summarise, the evidence to date partially supports the suggested scenario but more convincing signs of non-US economic improvement are needed – particularly better news from China.
When might this occur? Analysis of G7 data extending back to the 1960s indicates that real narrow money leads industrial output by nine months on average. This rule-of-thumb signalled, to within one month, the end of the 2008-09 recession: the six-month change in G7 real narrow money surged from August 2008, while the six-month industrial output change recovered strongly from April 2009 (i.e. eight months later).
Six-month growth of Chinese real narrow money rose significantly after March 2015, so the nine-month rule-of-thumb suggests a pick-up in industrial output momentum from end-2015. Allowing for reporting lags, therefore, Chinese economic news may show a convincing improvement in February / March 2016.
Risks to the suggested scenario include 1) the Chinese narrow money surge is a false positive signal and 2) the US economy is entering a period of weakness, rather than slowing modestly. The former possibility was considered in a previous post and judged to be unlikely. US weakness is a greater risk: in addition to slowing real narrow money expansion, the stocks cycle is turning down while corporate finances have deteriorated, questioning prospects for business investment and hiring. The monetary evidence, however, is currently flashing amber rather than red, with signs of improvement in weekly data for November – second chart**.
*Global = G7 plus emerging E7. Narrow money = currency in circulation plus demand / overnight deposits. Real = deflated by consumer prices.
**The final US data point is an estimate for November; other series are up to October.


UK money trends upbeat, corporate liquidity surging
Key UK money and credit measures continued to grow solidly in October, sending a positive message for economic prospects and supporting the case for an early rate rise.
The Bank of England’s broad money measure, M4ex, rose by 0.4% in October, pushing annual growth up to 4.5%, the fastest since January – see first chart.
The rate of increase of M4ex has been restrained recently by 1) a fall in financial sector deposits, which probably has little relevance for economic prospects, and 2) a switch of household deposits into National Savings (NS), which are not included in M4ex. A better guide to the availability of liquidity to finance private sector spending is the sum of M4 money held by households and private non-financial corporations (PNFCs) – i.e. “non-financial M4” – and outstanding NS. This increased by 0.6% in October, pushing annual growth up to 6.4%, the fastest since May 2008 – first chart.
The velocity of circulation of this measure has been broadly stable in recent years – see previous post. If velocity were to continue to move sideways, sustained 6% plus growth would be reflected, in time, in an equal rate of increase of national income. This, in turn, would imply inflation of 3.5% plus, assuming 2.5% trend output expansion. The MPC is unconcerned about, or oblivious to, this risk, judging from recent communications*.
The rise in broad money growth has been concentrated in the corporate sector, with annual growth of PNFC M4 rising to 12.7% in October, the fastest since June 2007.
Narrow money continues to expand more strongly than the broader aggregates. Non-financial M1 (i.e. currency in circulation and sight deposits of households and PNFCs) rose by 0.9% in October, lifting annual growth to 7.4%. This is, however, well down from a peak of 12.0% reached in October 2013.
Credit expansion is gathering pace, with the annual increase in M4ex lending up to 3.3% in October, the fastest since April 2009. Non-financial lending growth (i.e. to households and PNFCs) is lower, at 2.6%, although such lending has risen more strongly recently – at an annualised rate of 3.8% in the latest three months.
Of the various measures, real (i.e. inflation-adjusted) non-financial M1 has the best record as a leading indicator of the economy, accelerating before rises in GDP growth and contracting before recessions – second chart. Its six-month rate of increase has been little changed over the past year, consistent with GDP continuing to expand by about 2.5% per annum. Recent stronger broad money growth, however, suggests upside risk to this forecast.
*The word “money” did not appear in either the November or August Inflation Reports.


