
Entries from August 1, 2021 - August 31, 2021
US profits boosted by one-offs
 Simon Ward
 Post a Comment
National accounts profits numbers for Q2 released last week mirror recent strength in company earnings reports. The concept closest to S&P 500 earnings – corporate profits after tax – rose by 13% in Q2 to stand 36% above its level in Q4 2019. The national accounts series covers all corporations but S&P 500 operating earnings also grew by 36% between Q4 2019 and Q2 this year – see chart.

The national accounts analysis additionally contains a measure of “economic profits”, i.e. excluding inventory gains and adjusted for the difference between reported and economic depreciation*. Reflecting commodity price strength, inventory profits have been significant in recent quarters, while overreporting of depreciation (to minimise tax bills) fell in 2020 and has remained at a lower level in H1 2021.
This economic profits measure, therefore, has performed less impressively than “headline” earnings, rising by 10% in Q2 to stand 16% above its Q4 2019 level.
This measure, however, still overstates underlying profits strength because it includes government subsidy payments to corporations under various pandemic response schemes, the most significant of which has been the now-closed Paycheck Protection Program. The subsidy payment to corporations under this scheme accounted for 10% of economic profits in Q2 but will fall to zero over coming quarters**.
Q2 profits were also supported by payments under the Employee Retention Tax Credit scheme and grants to air carriers, among other emergency measures.
Excluding only the PPP subsidy, growth of economic profits between Q4 2019 and Q2 this year falls to just 4%.
The level of headline national accounts profits was 22% higher than this adjusted economic profits measure in Q2. A reasonable base case assumption is that this overshoot will be eliminated by Q2 2022.
The consensus forecast is for S&P 500 operating earnings to rise by a modest-sounding 3% in the year to Q2 2022. For national accounts profits to grow at the same pace, underlying profits – i.e. excluding inventory gains, subsidies etc. – might have to increase by more than a quarter. Such strength is implausible, requiring the unlikely combination of rapid economic growth with no associated downward pressure on margins from a tightening labour market.
*Profits after tax with inventory valuation adjustment (IVA) and capital consumption adjustment (CCAdj).
**The subsidy payment is recorded as occurring over the term of the loan, not when it is forgiven.
Eurozone slowdown on track, is real money growth bottoming?
Eurozone monetary trends have been suggesting an economic slowdown through end-2021. A recent moderation of consumer price momentum, however, has stabilised six-month real narrow money growth, hinting at a bottoming out of business surveys and other coincident indicators in early 2022.
The Ifo manufacturing survey is a timely indicator of German / Eurozone industrial momentum, displaying a strong contemporaneous correlation with German / Eurozone manufacturing PMIs (but with a longer history). The business expectations component peaked in March, falling for a fifth month in August – see chart 1.
Chart 1

The March peak is consistent with an August 2020 peak in Eurozone six-month real narrow money growth. The implied seven-month lead is slightly shorter than the historical average – the correlation between Ifo business expectations and Eurozone real money growth is maximised by applying a nine month lag to the latter.
Real narrow money growth, however, has moved sideways since May (July money numbers were released yesterday). The suggestion is that the Ifo indicator – along with PMIs and other business surveys – will weaken further during H2 but bottom out in early 2022.
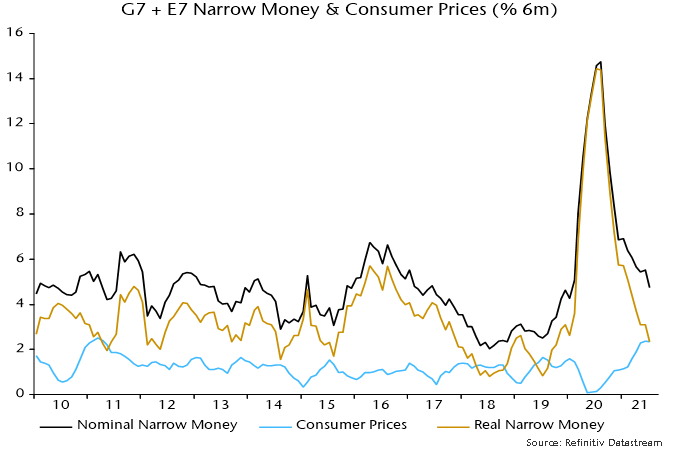
The recent stabilisation of real money growth is not entirely convincing: nominal money trends continued to weaken in June / July but this was offset by a slowdown in six-month consumer price momentum – chart 2.
Chart 2

The inflation slowdown, however, could extend, assuming that commodity prices (in euro terms) stabilise at their current level – chart 3.
Chart 3

A recovery in nominal money growth is required to warrant shifting to a positive view of economic prospects. Such a signal would relate to H1 2022 – earlier real money weakness has “baked in” likely economic disappointment over the remainder of 2021.
What could lift money growth? The most likely candidate is a pick-up in bank lending. Six-month growth of loans to the private sector recovered in July – chart 2 – while the most recent ECB bank lending survey reported the strongest expectations for credit demand since 2016.
The recent stabilisation of Eurozone six-month real narrow money growth contrasts with a further slowdown in the US – chart 4. The divergence / cross-over suggests improving Eurozone relative economic and equity market prospects, although US real growth could benefit from a faster inflation slowdown over coming months.
Chart 4

A further fall in Ifo manufacturing business expectations and other survey indicators during H2 would probably be associated with underperformance of European non-tech cyclical sectors relative to defensive sectors – chart 5.
Chart 5

Glimmers of hope in Chinese monetary details
Detailed monetary data for July released yesterday suggest that recent policy easing is beginning to support money growth, in turn hinting at a recovery in economic momentum from end-2021.
A sustained slowdown in six-month narrow money growth from July 2020 correctly signalled “surprise” Chinese economic weakness so far in 2021. The expectation here was that the PBoC would ease policy in Q2, supporting economic prospects for later in 2021. Adjustment was delayed but the reserve requirement ratio cut on 9 July appeared to mark a significant shift. The hope was that July monetary data would confirm a bottom in money growth.
The headline July numbers released on 11 August seemed to dash this hope, with six-month of “true M1” falling to a new low – see chart 1*.
Chart 1

The additional data released yesterday allow a breakdown of the deposit component of this measure between households, non-financial enterprises and government departments / organisations. It turns out that the further fall in growth in July was due to the latter public sector element, which is volatile and arguably less important for assessing prospects for demand and output.
Six-month growth of “private non-financial M1”, i.e. currency in circulation plus demand deposits of households and non-financial enterprises, rose for a second month in July. So did the corresponding broader M2 measure – chart 1.
This improvement needs to be confirmed by a recovery in overall narrow money growth in August, ideally accompanied by a further increase in the private sector measure. One concern is that the rebound in the latter has so far been driven by the household component – enterprise money growth remains weak.
Increased bond issuance and fiscal easing could lift public sector money growth during H2.
The corporate financing index in the Cheung Kong Graduate School of Business monthly survey is a useful corroborating indicator of money / credit trends – a rise signals easier conditions. The index bottomed in March but has yet to improve much – chart 2. August survey results will be released shortly.
Chart 2

*True M1 includes household demand deposits, which are omitted from the official M1 measure.
Why has the UK RPI / CPI inflation gap surged?
The fall in UK CPI inflation in July reported this week will be of limited comfort to policy-makers – a decline had been expected because of a large base effect and will be more than reversed in August. A bigger story was the further widening of the RPI / CPI inflation gap to an 11-year high. RPI inflation could top 5.5% in Q4 2021, boosting interest payments on index-linked gilts by a whopping £15 billion relative to the OBR’s Budget forecast.
CPI inflation fell from 2.5% in June to 2.0% in July but RPI Inflation eased by only 0.1 pp to 3.8%. RPIX inflation – excluding mortgage interest – was stable at 3.9%.
The RPI / CPI inflation gap, therefore, widened to 1.8 pp, its largest since June 2010. The RPIX / CPI inflation gap of 1.9 pp is the biggest on record since the inception of CPI inflation data in 1989 – see chart 1.
Chart 1

The widening gaps mainly reflect surging house prices, driven partly by Chancellor Sunak’s stamp duty holiday. House prices enter the RPI via the housing depreciation component*, which is linked to ONS house price data with a short lag – chart 2. This component has a 9.0% weight and rose by 9.9% in the year to July, contributing 0.9 pp to RPI inflation of 3.8%. The CPI omits owner-occupier housing costs.
Chart 2

Note that the housing depreciation weight has risen from 5.8% in 2014, i.e. the sensitivity of the RPI to house prices has increased by more than 50% since then.
The RPI / CPI and RPIX / CPI inflation gaps, however, have widened by more than implied by house prices alone – chart 3.
Chart 3

A likely additional influence has been the ONS decision to depart from its normal procedure and base 2021 CPI weights on 2020 rather than 2019 expenditure data. As previously explained, this has lowered the weight of categories hit hardest by the pandemic but now experiencing a rebound in demand and prices. An alternative calculation carrying over 2020 weights (based on 2018 expenditure data) to 2021 produces an annual inflation number for July of 2.5% rather than 2.0% – chart 4.
Chart 4

The RPI has been less affected because the normal procedure was followed of basing weights on expenditure shares in the 12 months to June of the previous year. 2021 weights, therefore, reflect spending in the year to June 2020 – the impact of the pandemic was smaller over this period than in calendar 2020.
So weighting effects are likely to have had a larger negative impact on CPI than RPI inflation.
The phase-out of the stamp duty holiday is being reflected in a slowdown in housing market activity but estate agents expect a shortage of supply to support prices, according to the RICS survey. Recent strength may not yet have fed through fully to the RPI housing depreciation component – the annual rise in the latter of 9.9% in July compares with a 13.2% increase in the ONS house price index in the year to June.
Assume, as a reasonable base case, that that the annual increase in the housing depreciation component moderates to 8.0% in Q4 2021 while other influences on the RPI / CPI inflation gap are stable. This would imply a decline in the gap from the current 1.8 pp to 1.6 pp. The Bank of England’s August forecast of CPI inflation of 4.0% in Q4 would then read across to RPI inflation of 5.6%.
The OBR’s March Economic and fiscal outlook projected a 2.4% rise in the RPI in the year to Q4 2021. According to its debt interest ready reckoner, a 1% rise in the RPI boosts interest costs on index-linked gilts by £4.8 billion in the following year. A Q4 overshoot of 3.2 pp, therefore, would imply a spending increase of £15.2 bn – or 0.6% of annual GDP – relative to the Budget forecast.
*House prices also feed into the mortgage interest component, as well as estate agents’ fees and ground rent.
Disappointing July money data
The assessment here remains that the global manufacturing PMI new orders index peaked in May and will fall through H2 2021, reflecting a decline in global six-month real narrow money growth from July 2020 through May. Real money growth, however, stabilised between May and June, raising the possibility that a turning point was at hand. A recovery in real money trends during Q3 would be a positive signal for economic prospects for H1 2022 and could support a second leg of the reflation trade.
Incoming monetary news for July is unfavourable for this scenario. Global six-month real narrow money growth is estimated to have fallen further last month to its lowest since October 2019, based on monetary data covering 70% of the G7 plus E7 aggregate monitored here – see chart 1.
Chart 1

A pick-up in six-month consumer price inflation contributed to the fall in real narrow money growth into May / June. Price momentum stabilised in July but there was a further decline in nominal money expansion – chart 2.
Chart 2
Six-month real narrow money growth is estimated to have fallen in the US, China, Japan and Brazil, with India stable – chart 3. (The US July money number is estimated from weekly data on currency in circulation and commercial bank deposits.)
Chart 3

A recovery in the global measure remains plausible in August / September. Recent commodity price stabilisation suggests a decline in six-month inflation, while Chinese money growth may pick up in lagged response to policy easing.
Global six-month real narrow money growth has led turning points in manufacturing PMI new orders by 6-7 months on average historically. The further fall in real money growth in July, therefore, suggests that PMI weakness will extend into early 2022.
The PMI new orders index is a good indicator of underlying industrial momentum but output was held back by supply issues during H1, disrupting the normal relationship – chart 4. Output momentum could rebound temporarily in Q3 as supply constraints ease even as the PMI moderates.
Chart 4

This possibility complicates market analysis. The performance of “traditional” cyclical equity market sectors (i.e. excluding IT and communication services) relative to defensive sectors has correlated better with PMI new orders than industrial output, suggesting that they will lag if the PMI slides – chart 5.
Chart 5

A near-term rebound in output momentum, however, could be relevant for assessing the monetary backdrop for markets. Global six-month industrial output growth fell back below real money growth in April – chart 6. The return to a positive real money / output growth gap may explain continued strength in equity market indices despite signs of economic cooling.
Chart 6

A negative cross-over, however, is possible if there is a large output catch-up effect and real money growth remains weak.
The monetary signal of an economic slowdown is starting to be confirmed by non-monetary leading indicators. Chart 7 shows six-month rates of change of composite indices based on the OECD’s methodology but calculated independently. The suggestion is that the loss of economic momentum now clearly visible in China will be mirrored in the US and the rest of the G7 in H2 2021.
Chart 7

Global money trends at critical juncture
The economic / market view here remains cautious based on 1) an expected slowdown in global industrial momentum through H2 (already apparent in Chinese data) and 2) recent less favourable “excess” money conditions.
Global six-month real narrow money growth, however, may have bottomed in May / June. A Q3 rebound would signal a stronger economy in H1 2022. An associated improvement in excess money could reenergise the reflation trade in late 2021.
The issue can be framed in cycle terms: does the recent top in the global manufacturing PMI new orders index mark the peak of the stockbuilding cycle (implying a shortened cycle) or will the peak be delayed until H1 2022?
Possible drivers of a real money growth rebound include Chinese policy easing, a slowdown in global consumer price momentum and a pick-up in US / Eurozone bank loan expansion.
The H2 industrial slowdown view remains on track. The global manufacturing PMI new orders index fell further in July, confirming May as a top. Chinese orders were notably weak and have led the global index since the GFC – see chart 1.
Chart 1

Global six-month real narrow money growth fell steadily between July 2020 and May but a stabilisation in June has been confirmed by additional monetary data released over the last week – chart 2.
Chart 2

Will PBoC policy easing drive a recovery in Chinese / global money growth? The hope here was that the 15 July cut in reserve requirements would be reflected in an early further fall in money market interest rates and easier credit conditions. Three-month SHIBOR, however, has moved sideways while corporate credit availability is little changed, judging from the July Cheung Kong Graduate School of Business survey – chart 3. July money data, therefore, could show limited improvement.
Chart 3

Global six-month real money growth should receive support from a slowdown in consumer price momentum as commodity price and bottleneck effects fade. Eurozone six-month CPI inflation eased on schedule in July, with further moderation suggested and the move lower likely to be mirrored in other countries (Tokyo July numbers also showed a slowdown) – chart 4.
Chart 4

US monetary prospects are foggy. Disbursement of stimulus payments boosted nominal money growth over March-May but there was a sharp slowdown in June. Weekly data indicate a reacceleration in July as the Treasury ran down its cash balance at the Fed to comply with debt ceiling legislation – chart 5. This effect, however, will be temporary and an improving fiscal position suggests a reduced contribution from monetary financing during H2 and into 2022.
Chart 5

Stable or higher US money growth, therefore, may require a pick-up in bank loan expansion. The Fed’s July senior loan officer survey, released yesterday, is hopeful, showing a further improvement in demand balances across most loan categories (not residential mortgages) – chart 6. The ECB’s July lending survey gave a similar message – chart 7. The survey indicators, however, are directional and the magnitude of a likely loan growth pick-up is uncertain. Actual lending data remained soft through June.
Chart 6

Chart 7

Failure of global real money growth to recover in Q3 – and especially a further slowdown – would suggest that the stockbuilding cycle is already at or close to a peak. The cycle bottomed in Q2 2020 and – based on its average historical length of 3.33 years – might be expected to reach another low in H2 2023, in turn implying a peak no earlier than H1 2022. As previously discussed, however, the current upswing could be short to compensate for a long (4.25 years) prior cycle.
Proponents of the consensus view that replenishment of stocks will underpin solid industrial growth in H2 cite the still-low level of the global manufacturing PMI finished goods inventories index – chart 8. Research conducted here, however, indicates that the stocks of purchases index (i.e. raw materials / intermediate goods) is a better gauge of the stockbuilding cycle and tends to lead the finished goods index. The former index is already at a level consistent with a cycle top and the rate of change relationship with the new orders index is another reason for expecting orders to weaken significantly during H2 – chart 9.
Chart 8

Chart 9

